Fig. 2.
Download original image
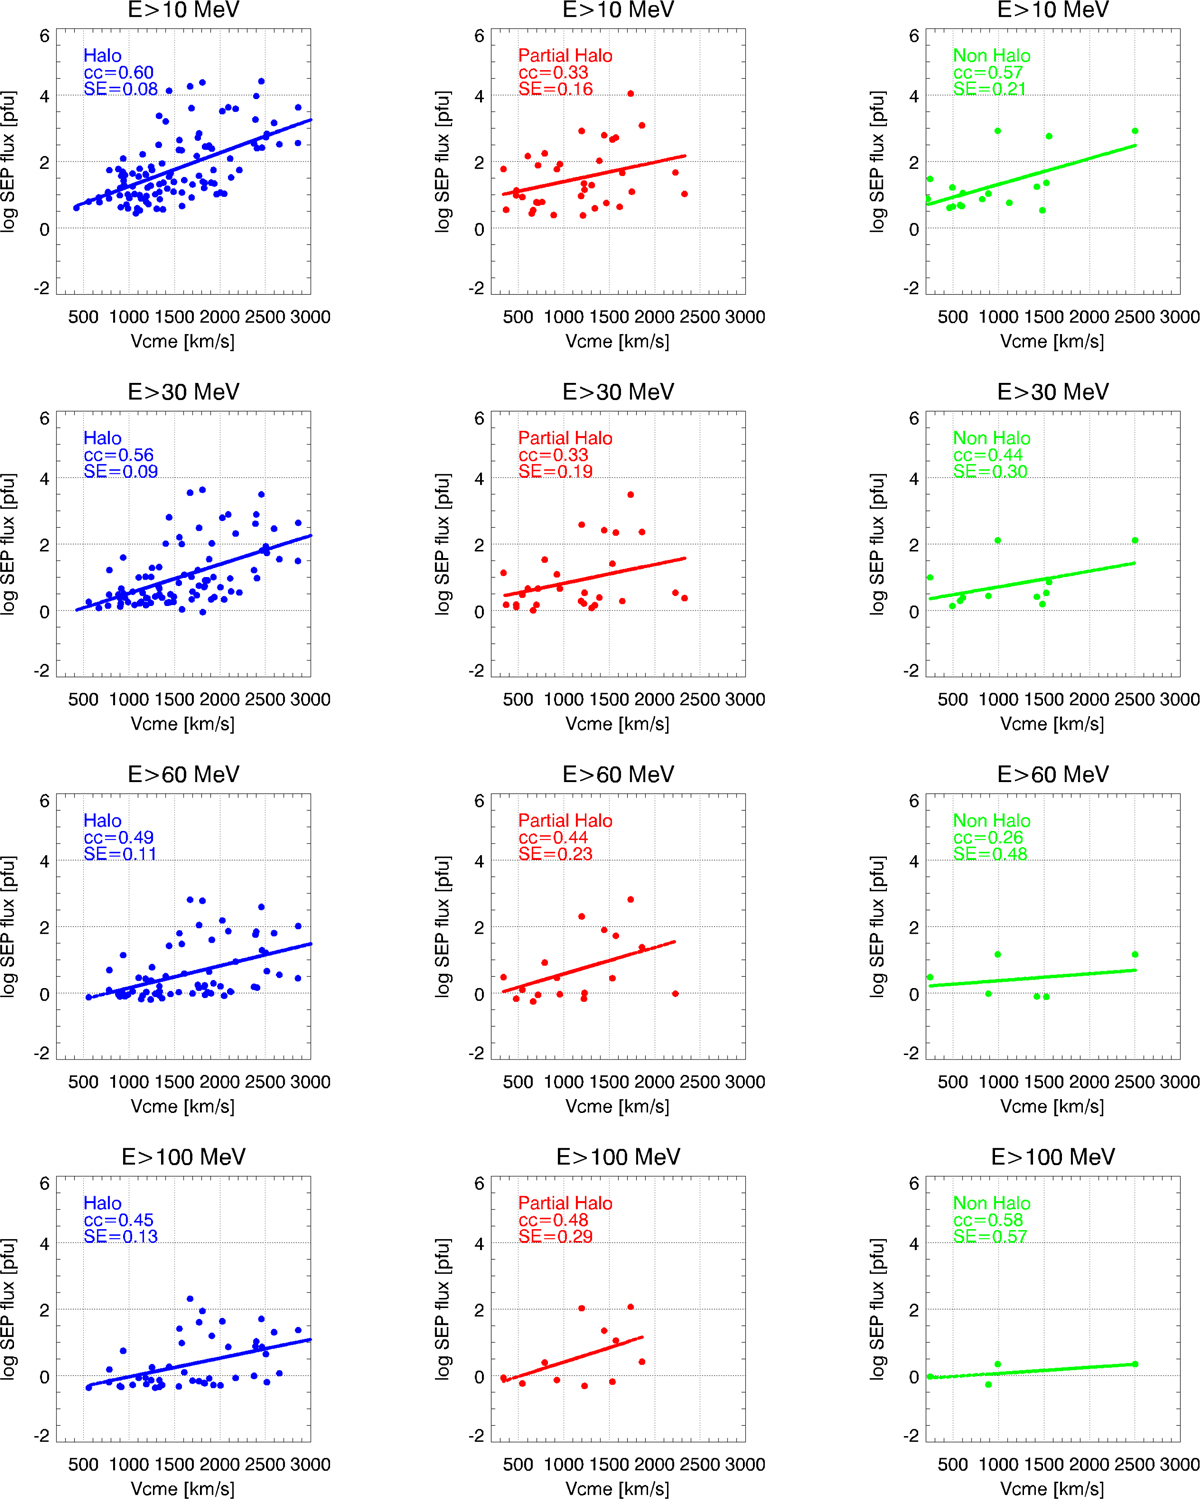
Linear regressions between the CME speed and the logarithm of the SEP proton peak flux at several integral energy channels. The first column (stack of four plots) provides the regressions for the Halo CMEs (blue color). The second column shows the regressions for the Partial halo CMEs (red color) and the third column includes the regressions for the non halo CMEs (green color). For each column, from top to bottom the corresponding integral energy channels are E > 10 MeV, E > 30 MeV, E > 60 MeV and E > 100 MeV
Current usage metrics show cumulative count of Article Views (full-text article views including HTML views, PDF and ePub downloads, according to the available data) and Abstracts Views on Vision4Press platform.
Data correspond to usage on the plateform after 2015. The current usage metrics is available 48-96 hours after online publication and is updated daily on week days.
Initial download of the metrics may take a while.