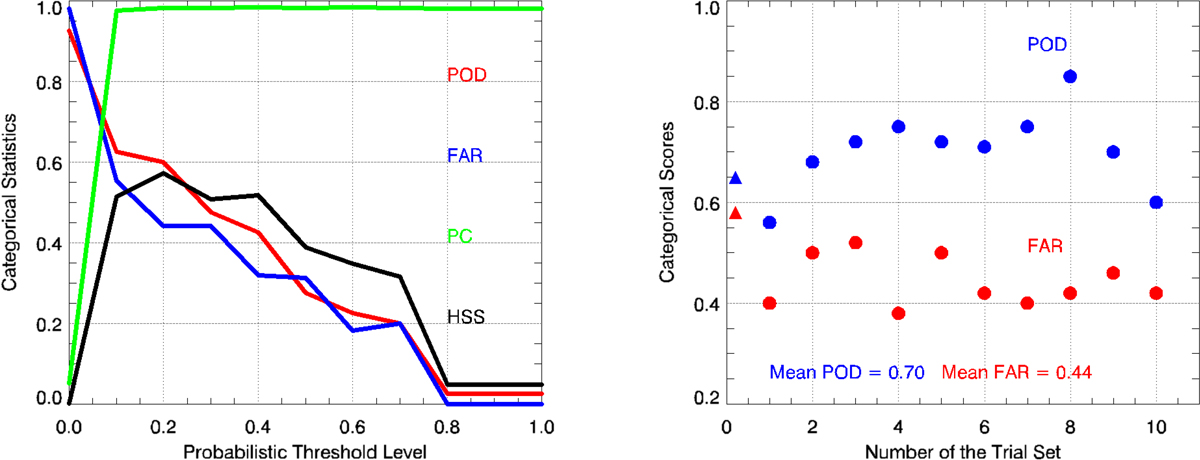
Fig. 6.
Download original image
An indicative example of the categorical performance statistics for the CME module as a function of probability thresholds (panel on the left) and the obtained POD and FAR for all 10 different trials, depicted as circles (panel on the right). The obtained POD and FAR from the initial sample (see Sect. 5.1.1 and Figure 5) are also marked in this latter panel as triangles, for comparison.
Current usage metrics show cumulative count of Article Views (full-text article views including HTML views, PDF and ePub downloads, according to the available data) and Abstracts Views on Vision4Press platform.
Data correspond to usage on the plateform after 2015. The current usage metrics is available 48-96 hours after online publication and is updated daily on week days.
Initial download of the metrics may take a while.