Open Access
Fig. 10
Download original image
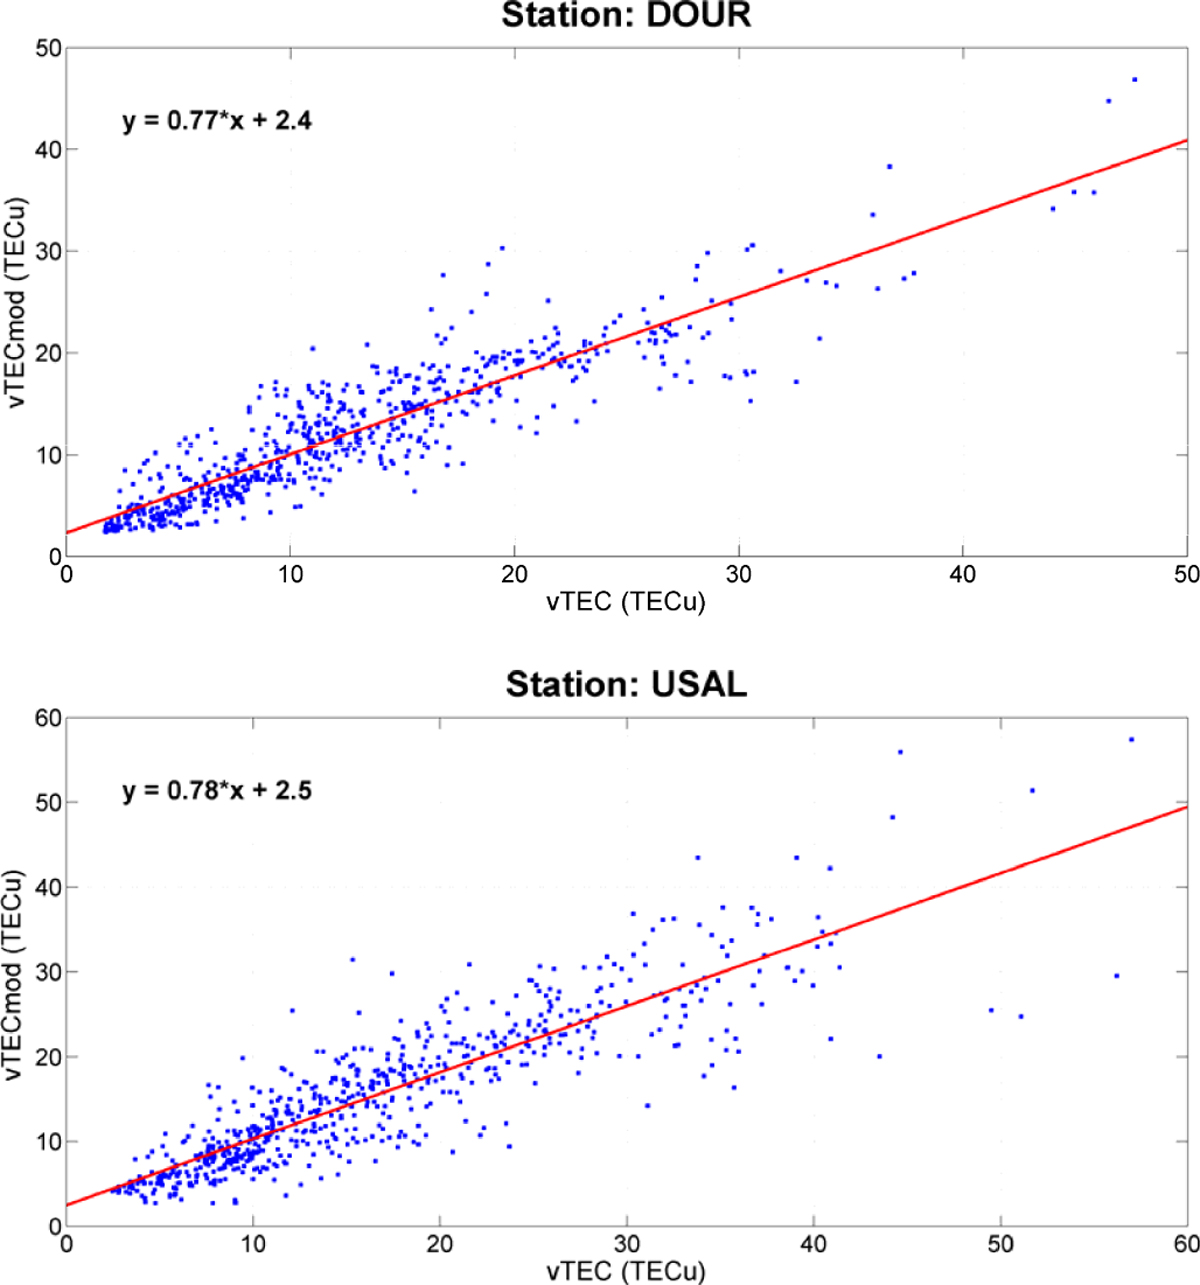
The scatter plots between vTEC modeled and estimated values obtained over the DOUR (top panel) and USAL (bottom panel) locations for all the events listed in Table 2. The linear regression is also plotted with the red line in both cases.
Current usage metrics show cumulative count of Article Views (full-text article views including HTML views, PDF and ePub downloads, according to the available data) and Abstracts Views on Vision4Press platform.
Data correspond to usage on the plateform after 2015. The current usage metrics is available 48-96 hours after online publication and is updated daily on week days.
Initial download of the metrics may take a while.