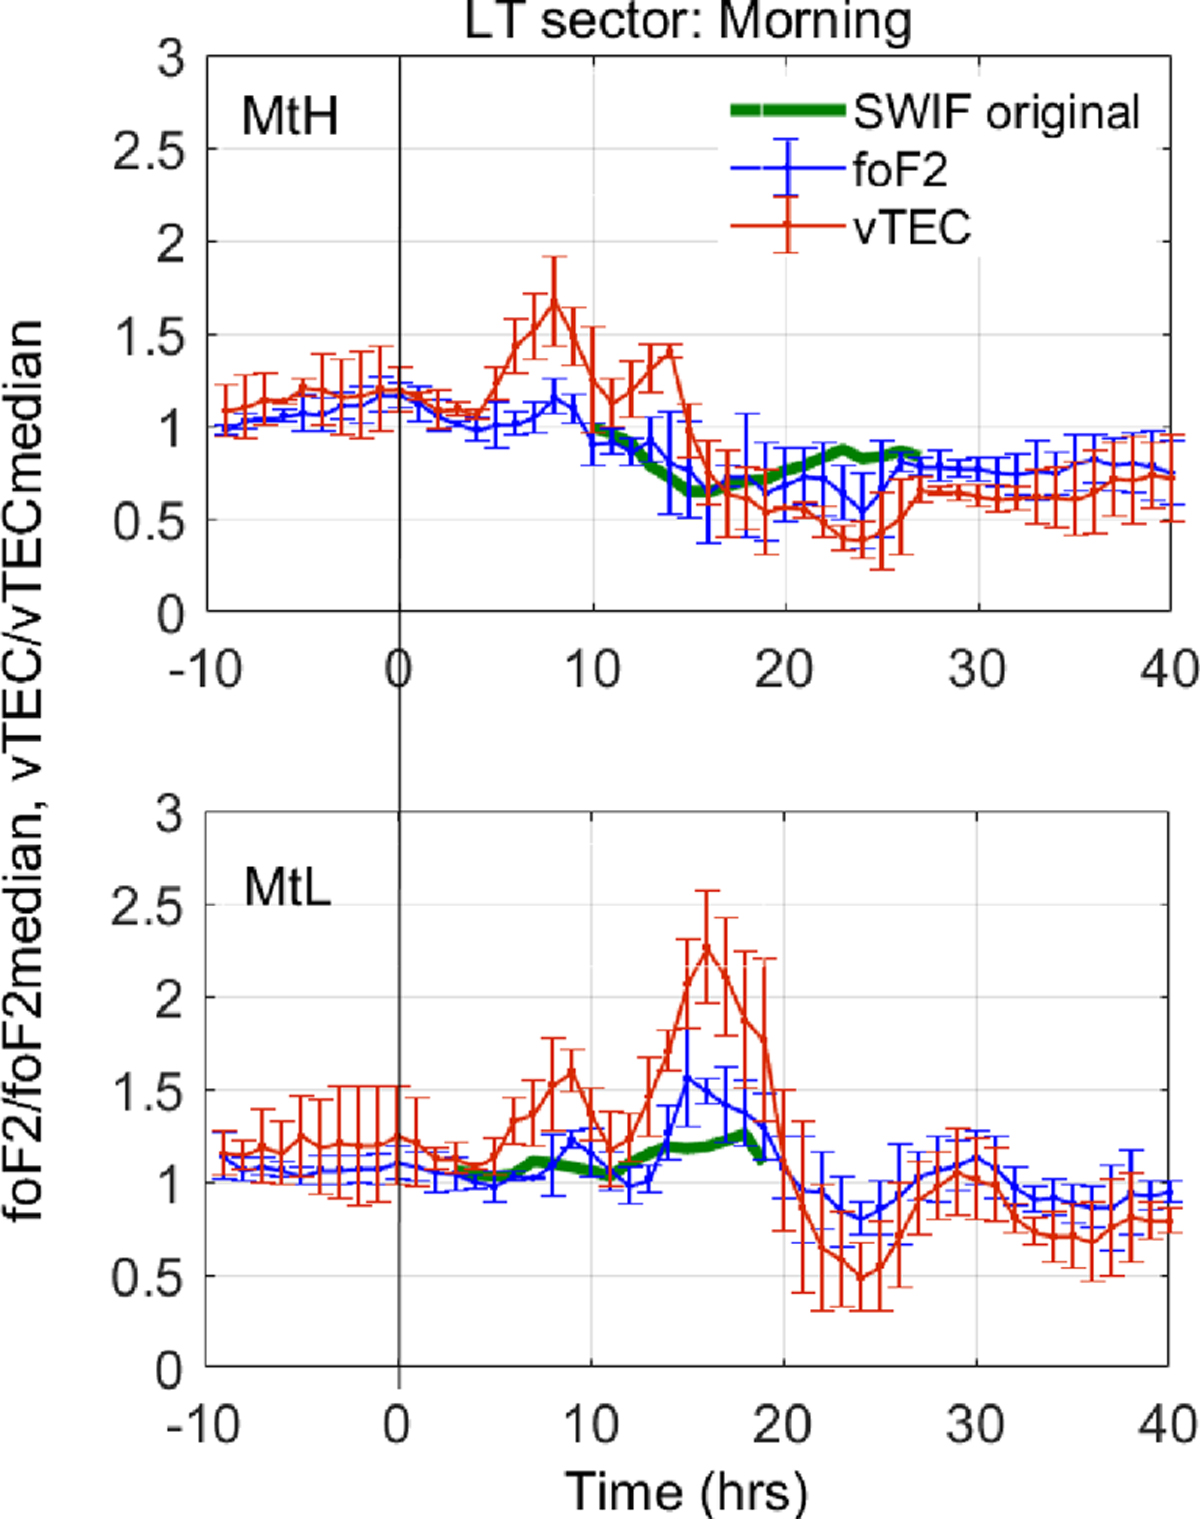
Fig. 3
Download original image
The results of the superposed epoch analysis for the vTEC and foF2 storm-time response in case the observation point is located in the morning LT sector at the storm onset, for MtH (top panel) and MtL (bottom panel) locations. The predictions that the original SWIF’s expressions can provide is also included (green line). Error bars represent standard deviations. The vertical black line at 0 hrs indicates the storm onset time.
Current usage metrics show cumulative count of Article Views (full-text article views including HTML views, PDF and ePub downloads, according to the available data) and Abstracts Views on Vision4Press platform.
Data correspond to usage on the plateform after 2015. The current usage metrics is available 48-96 hours after online publication and is updated daily on week days.
Initial download of the metrics may take a while.