Fig. 1
Download original image
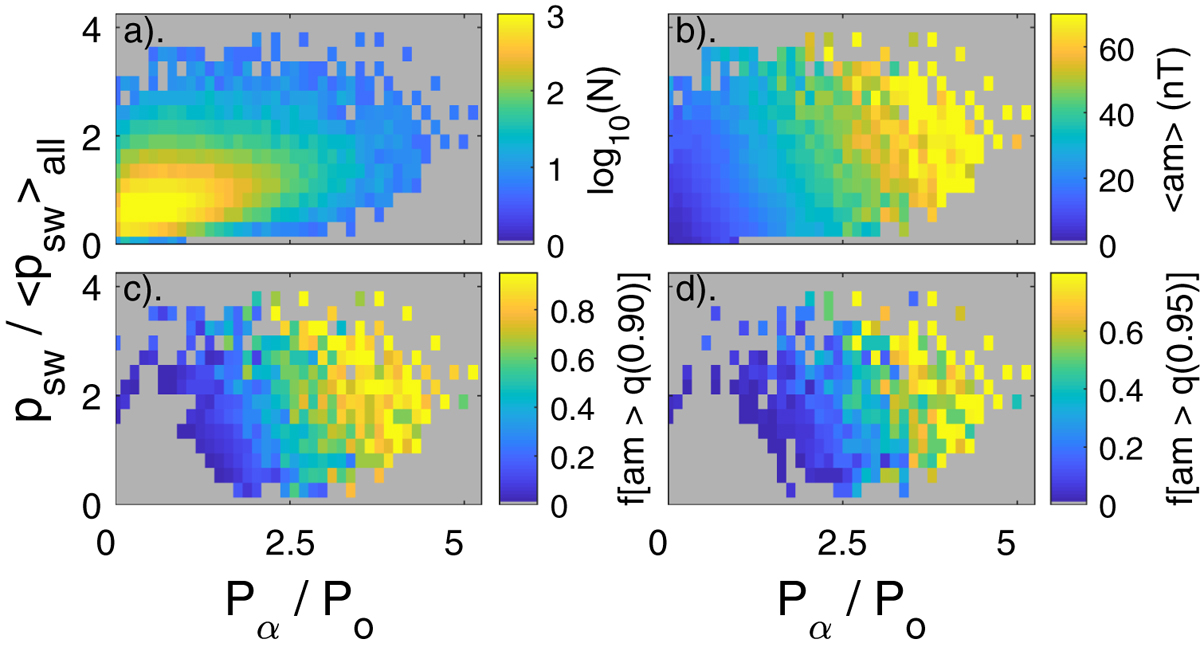
Plots of observed sample numbers, averages and occurrence frequencies, all in bins of normalised solar wind dynamic pressure, p sw/〈p sw〉 that are 0.27 wide and normalised magnetospheric power input (P α /P o) that are 0.135 wide, where 〈p sw〉 and P o are the means of, respectively, p sw and P α for all the data, which are from 1995 to 2019, inclusive. (a) The logarithm to base 10 of the number of 1-minute samples in each bin, log10(N). (b) The mean of the am index, 〈am〉, linearly interpolated to 60 min after the time of the interplanetary observation. (c) The occurrence frequency of interpolated am exceeding the 90th percentile for the distribution for the whole data set of interpolated values for 1995–2019, f[am > q(0.90)]. (d) The occurrence frequency of interpolated am values exceeding the 95th percentile for the whole data set of interpolated values for 1995–2019, f[am > q(0.95)].
Current usage metrics show cumulative count of Article Views (full-text article views including HTML views, PDF and ePub downloads, according to the available data) and Abstracts Views on Vision4Press platform.
Data correspond to usage on the plateform after 2015. The current usage metrics is available 48-96 hours after online publication and is updated daily on week days.
Initial download of the metrics may take a while.