Fig. 10
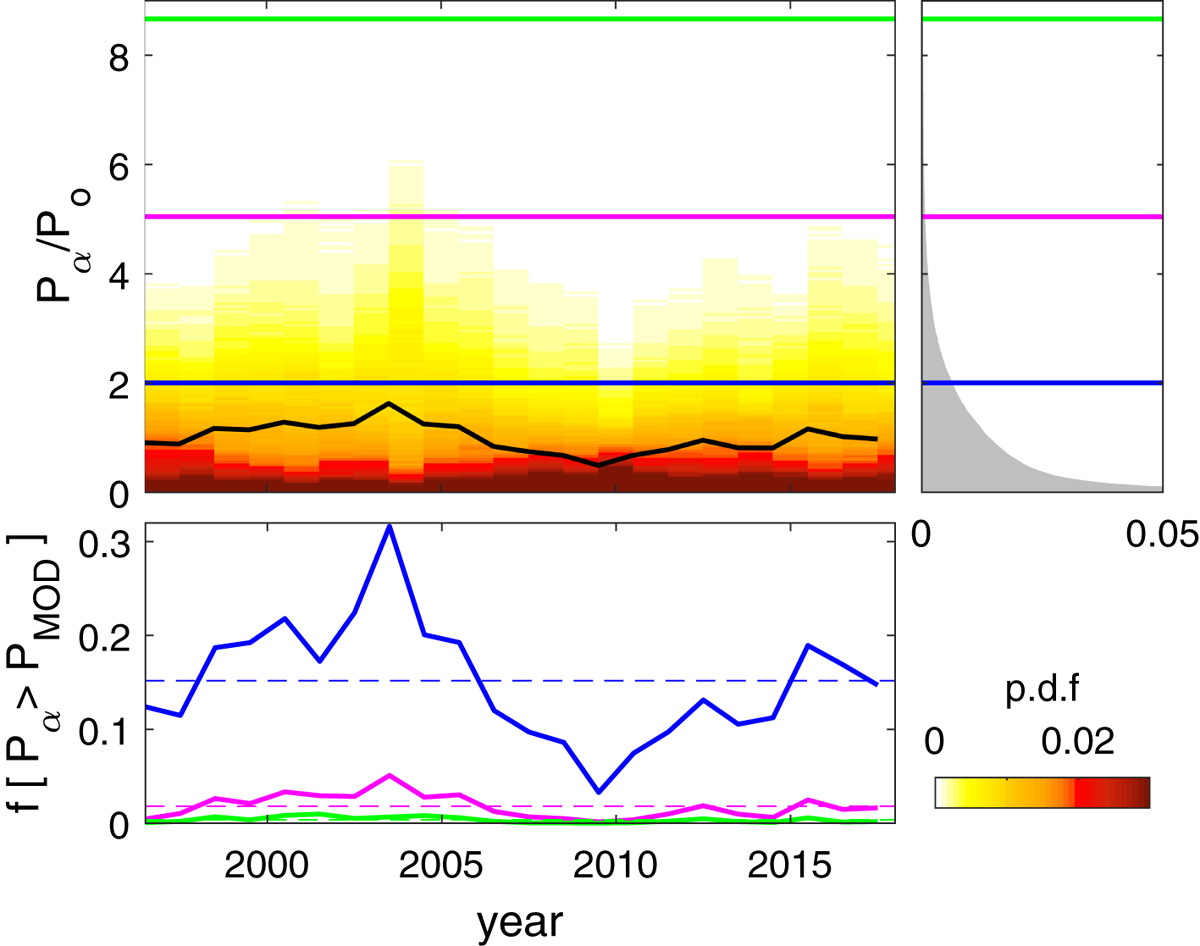
Download original image
Comparison of the power input to the magnetosphere P MOD for the BATSRUS model run, computed using the model input conditions (listed in Tab. 1) and the theoretical formulation of Vasyliunas et al. (1982), compared to the values from one-minute interplanetary data, P α , computed for 1995–2017. The coloured lines are for the three plateau levels of V sw used in the simulations: (blue) V sw = 400 km s−1 (for simulation time t < 100 min); (mauve) V sw = 800 km s−1 (for 120 < t < 100 min); and (green) V sw = 1200 km s−1 (for 180 < t < 240 min). (a) Annual distributions of P α /P o, where P o is the mean value for all samples in the 22 years. The black line shows the annual means of P α /P o. (b) The distribution of P α /P o for all years (in gray), again compared to the three P MOD/P o values. (c) The variation of the fraction of time that P α exceeds P MOD, f [P α > P MOD]. The horizontal coloured dashed lines are the mean values over the 1995–2017 period.
Current usage metrics show cumulative count of Article Views (full-text article views including HTML views, PDF and ePub downloads, according to the available data) and Abstracts Views on Vision4Press platform.
Data correspond to usage on the plateform after 2015. The current usage metrics is available 48-96 hours after online publication and is updated daily on week days.
Initial download of the metrics may take a while.