Fig. 11
Download original image
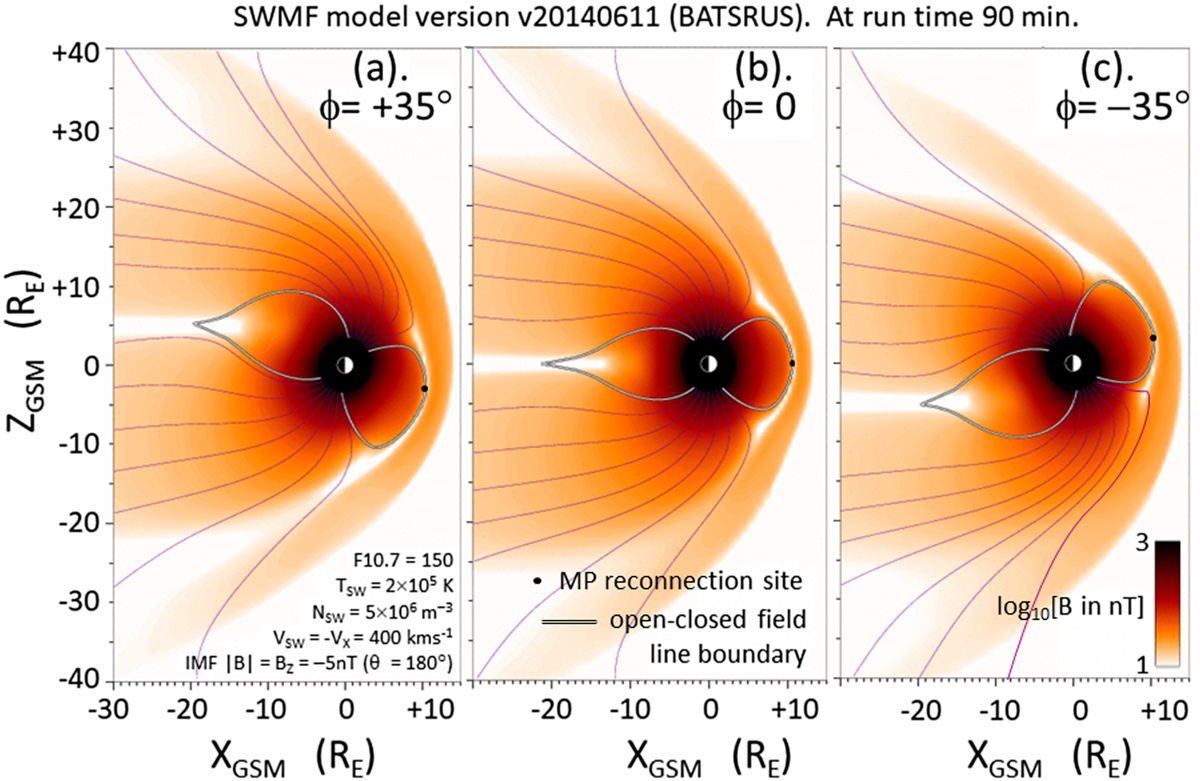
Model simulations of the magnetic field intensity by the BATSRUS global MHD model for dipole tilts ϕ of (a) +35°, (b) 0 and (c) −35°. Each plot is for simulation run time t = 90 min. The open-closed field line boundary is shown in each case and the black dot gives the location of the magnetopause reconnection site. The mauve lines are open magnetospheric field lines separated by 7° along the moon-midnight cross section of the ionospheric polar caps. A summary of model inputs is given in Table 1.
Current usage metrics show cumulative count of Article Views (full-text article views including HTML views, PDF and ePub downloads, according to the available data) and Abstracts Views on Vision4Press platform.
Data correspond to usage on the plateform after 2015. The current usage metrics is available 48-96 hours after online publication and is updated daily on week days.
Initial download of the metrics may take a while.