Fig. 16
Download original image
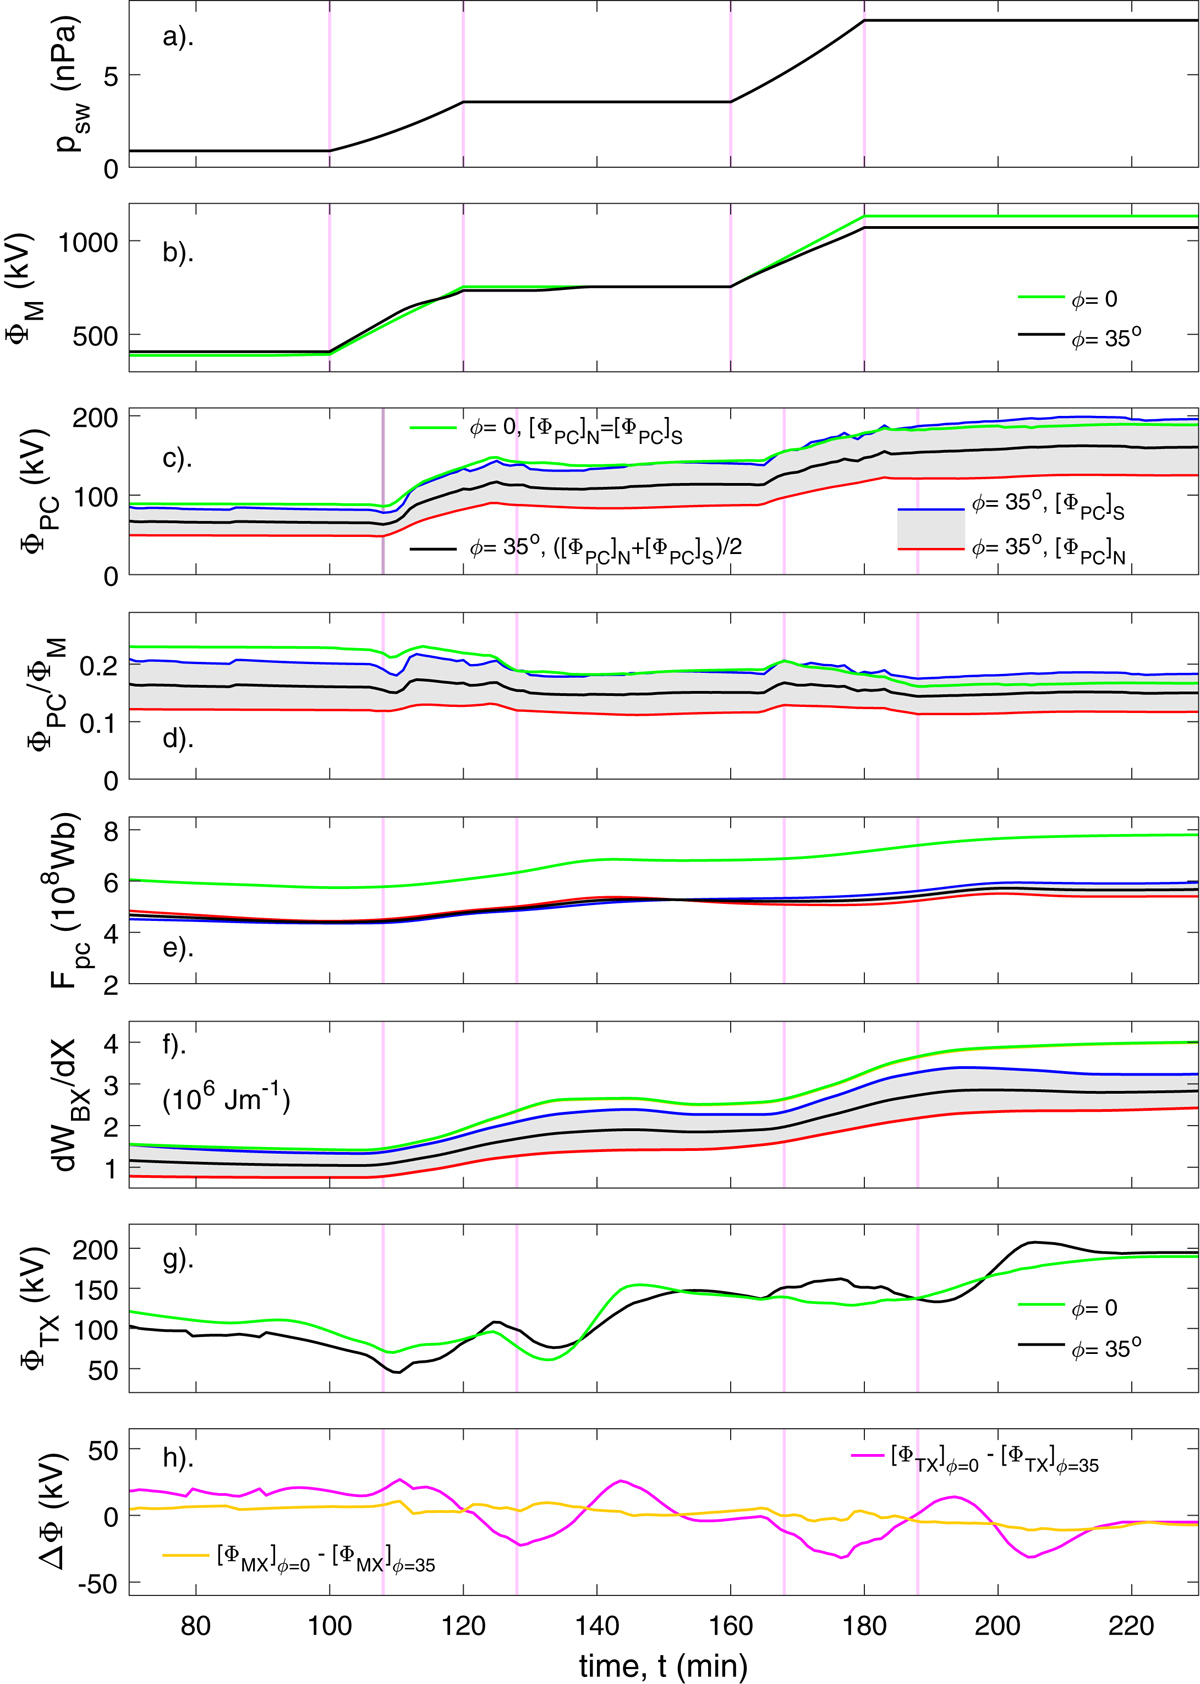
Modelled effect of solar wind speed changes. Between simulation times t of 100 min and 120 min and between 160 min and 180 min the solar wind velocity V SW was ramped up linearly. These times are marked by vertical pink lines. (a) The resulting variation in solar wind dynamic pressure, p sw. (b) The voltage placed across the magnetosphere by the solar wind flow, ΦM = V SW[B Z ]GSMΔY M, where ΔY M is the width of the magnetosphere in the Y direction of the GSM frame (here taken to be at the average X GSM of the tail reconnection X- line, X R). The green line is for ϕ = 0 and the black line for ϕ = 35°. (c) The transpolar voltages across the ionospheric polar caps. The green line is for ϕ = 0 for which the voltages across the northern and southern polar caps, [ΦPC]N and [ΦPC]S, are essentially identical. The blue and red and lines are [ΦPC]N and [ΦPC]S for ϕ = +35° (i.e., for the summer and winter hemispheres). The area between the two is shaded grey and the black line is the average of [ΦPC]N and [ΦPC]S. This colour scheme is used in all panels (d)-(f) showing equivalent parameters. (d) The reconnection efficiencies, [ΦPC]N/ΦM and [ΦPC]S/ΦM. (e) The total open magnetic fluxes in the northern and southern hemispheres [F PC]N and [F PC]S. (f) The magnetic energy stored per unit length of the tail at X GSM ≈ X R, the average X GSM of the tail reconnection X-line, [dW BX /dX]N and [dW BX /dX]S. (g). The tail current sheet reconnection voltages, ΦTX. (h) The difference in reconnection voltages for the ϕ = 0 and ϕ = 35° simulations, ΔΦ: the orange line is for the inferred reconnection voltages in the dayside magnetopause, ΔΦ = [ΦMX] ϕ=0 − [ΦMX] ϕ=35, the mauve line is for the inferred reconnection voltages in the nightside cross-tail current sheet, ΔΦ = [ΦTX] ϕ=0 − [ΦTX] ϕ=35. The vertical pink lines in panels (c)–(h) bound the solar wind velocity increases lagged by the inferred average propagation delay of 8 min. The average tail reconnection site varied between X GSM = −21 R E and X GSM = −24 R E for ϕ = 0 and at X GSM between −17 R E and −20 R E for ϕ = 35°.
Current usage metrics show cumulative count of Article Views (full-text article views including HTML views, PDF and ePub downloads, according to the available data) and Abstracts Views on Vision4Press platform.
Data correspond to usage on the plateform after 2015. The current usage metrics is available 48-96 hours after online publication and is updated daily on week days.
Initial download of the metrics may take a while.