Fig. 3
Download original image
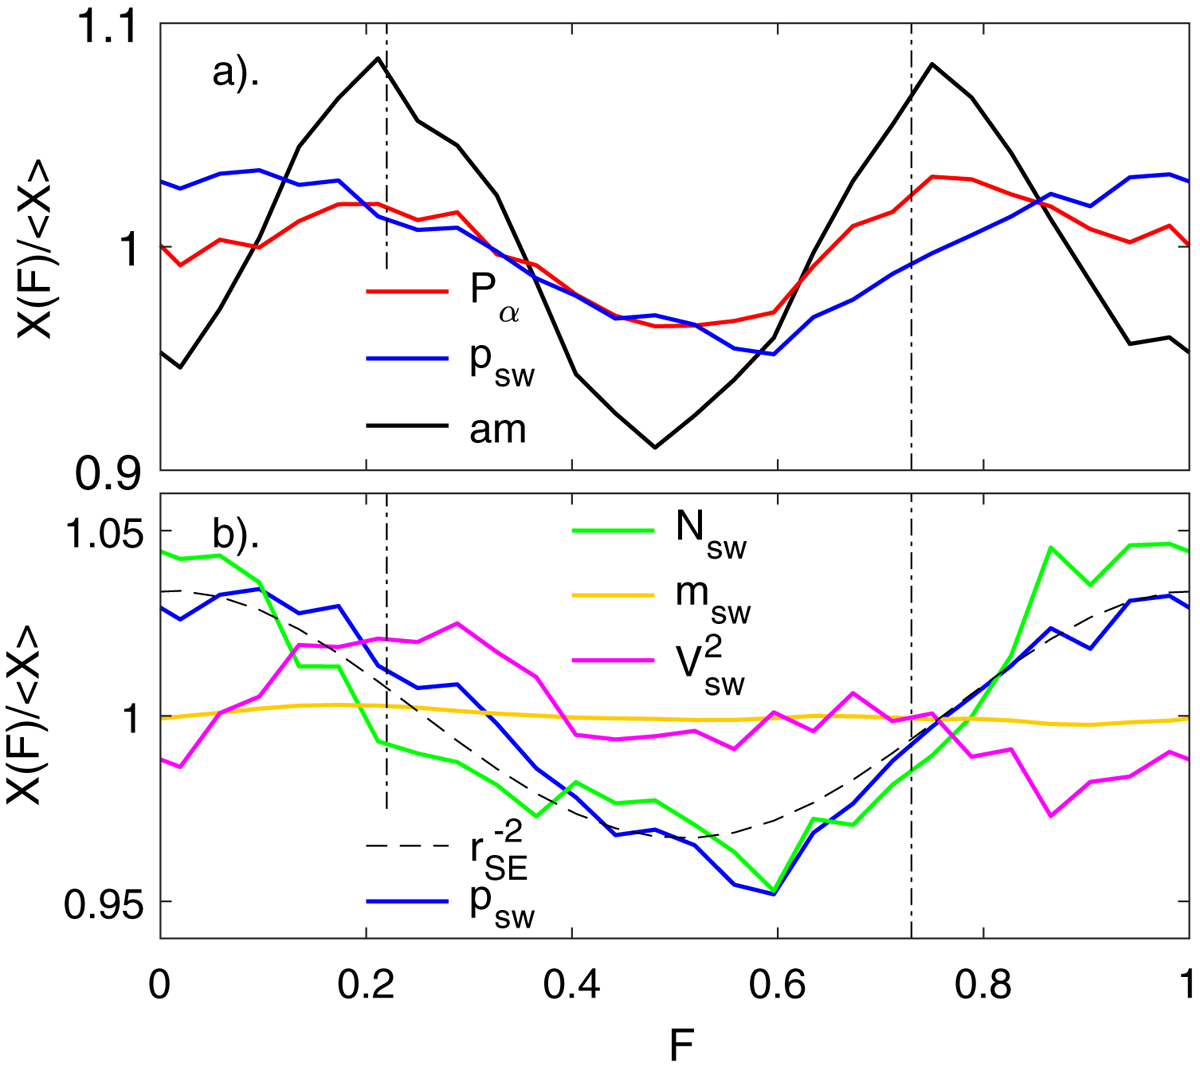
Average variations with fraction of year, F. The data are for 1995–2019, inclusive and are binned into 36 equal width bins of F (each just over 10 days in length) and a 3-point boxcar running mean applied. The data are then normalised by dividing by the mean for all samples. (a) Shows the normalised variation in power input into the magnetosphere, P
α
(red line); the solar wind dynamic pressure, p
sw (blue line) and the am index (black line). (b) The variations of the component terms in p
sw (which is again shown by the blue line): the mean solar wind ion mass, m
sw (orange line); the solar wind number density, N
sw (green line) and the square of the solar wind speed, V
sw
2 (mauve line). The black dashed line is the inverse square of the Sun-Earth distance, ![]() . The vertical dot-dash lines mark the equinoxes.
. The vertical dot-dash lines mark the equinoxes.
Current usage metrics show cumulative count of Article Views (full-text article views including HTML views, PDF and ePub downloads, according to the available data) and Abstracts Views on Vision4Press platform.
Data correspond to usage on the plateform after 2015. The current usage metrics is available 48-96 hours after online publication and is updated daily on week days.
Initial download of the metrics may take a while.