Fig. 4
Download original image
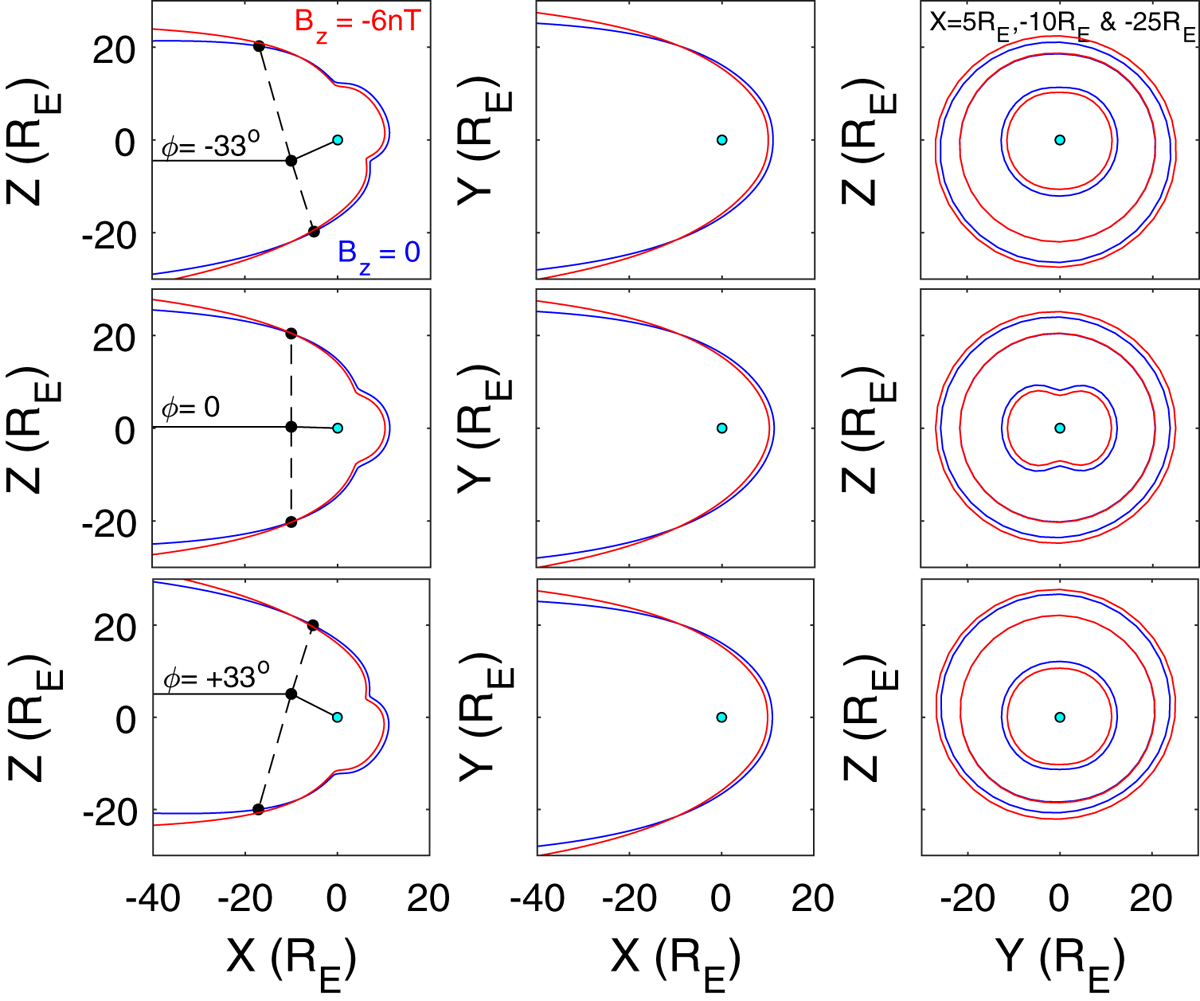
Magnetopause locations in the Geocentric Solar Magnetospheric (GSM) frame of reference from the empirical model by Lin et al. (2010) which treats northern and southern hemispheres separately, so allowing for the hemispheric difference in the offsets of the magnetic poles from the rotation poles. The blue and red lines are for IMF B z (in the GSM frame) of zero and −6 nT, respectively. The plots use the mode values of the distributions of solar wind static pressure p i = N SW k B T SW + B 2/2μ o and dynamic pressures p SW = N SW m SW V SW 2 which are p i = 0.015 nPa and p SW = 1.5 nPa for 1995–2017 (inclusive). The left-hand column gives views of the X GSM Z GSM plane (viewing Earth from the dawn side); the middle column gives views of the X GSM Y GSM plane (viewing Earth from over the north pole) and the right-hand column gives three views in planes parallel to the Z GSM Y GSM plane (viewing Earth from the Sun) at X GSM = 5 R E, −10 R E, and −25 R E. The top row shows results for dipole tilt ϕ = −33°, the middle row for ϕ = 0, and the bottom row for ϕ = +33°. The dashed lines in the left-hand column shows the bisector of the tail “hinge angle”.
Current usage metrics show cumulative count of Article Views (full-text article views including HTML views, PDF and ePub downloads, according to the available data) and Abstracts Views on Vision4Press platform.
Data correspond to usage on the plateform after 2015. The current usage metrics is available 48-96 hours after online publication and is updated daily on week days.
Initial download of the metrics may take a while.