Fig. 7
Download original image
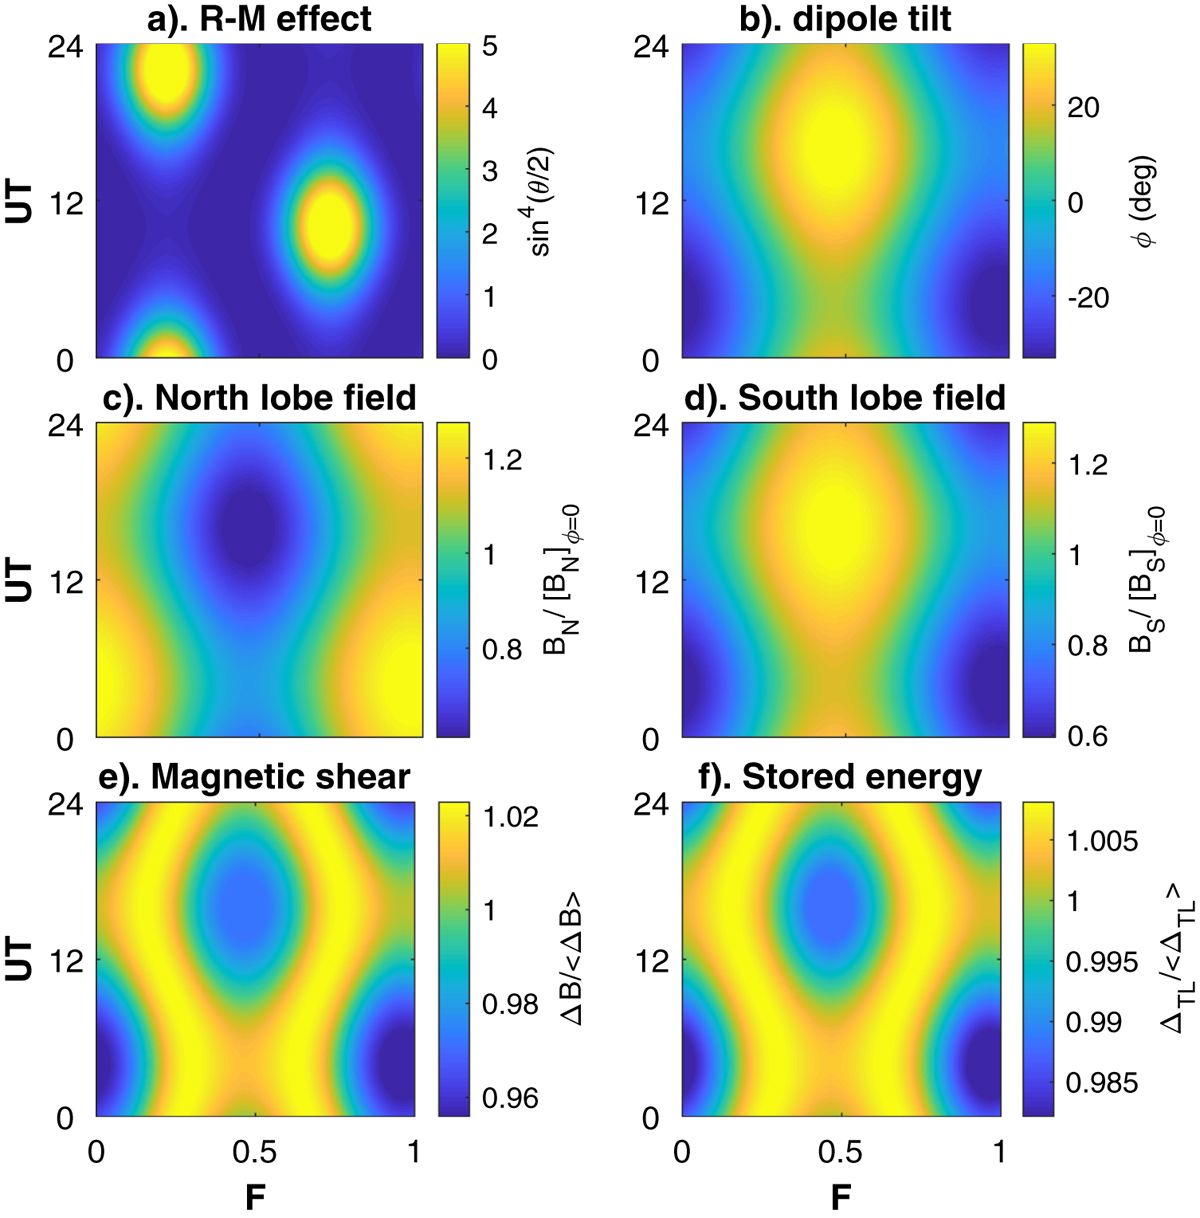
Time-of-year (F) – UT plots based on the dependencies on ϕ shown in Figure 6 for IMF B z = −6 nT and solar wind dynamic pressure, p SW = 1.5 nT. For comparison (a) shows the Russell-McPherron pattern of IMF orientation factor sin4(θ/2) for unit IMF in the +Y or the −Y direction of the GSEQ frame (where θ is the IMF clock angle in the GSM frame). (b) shows the F-UT pattern of the dipole tile angle ϕ. (c) The peak northern hemisphere lobe field along the hinge angle bisector, B N. (d) The peak southern hemisphere lobe field along the hinge angle bisector, B S. (e) The peak magnetic shear across the current sheet at the hinge point, ΔB = B N + B S. (f) The fractional rise ΔTL in total energy stored in the tail (between X GSE = −50 R E and X GSE = −5 R E) compared to for IMF B z = 0.
Current usage metrics show cumulative count of Article Views (full-text article views including HTML views, PDF and ePub downloads, according to the available data) and Abstracts Views on Vision4Press platform.
Data correspond to usage on the plateform after 2015. The current usage metrics is available 48-96 hours after online publication and is updated daily on week days.
Initial download of the metrics may take a while.