Fig. 8
Download original image
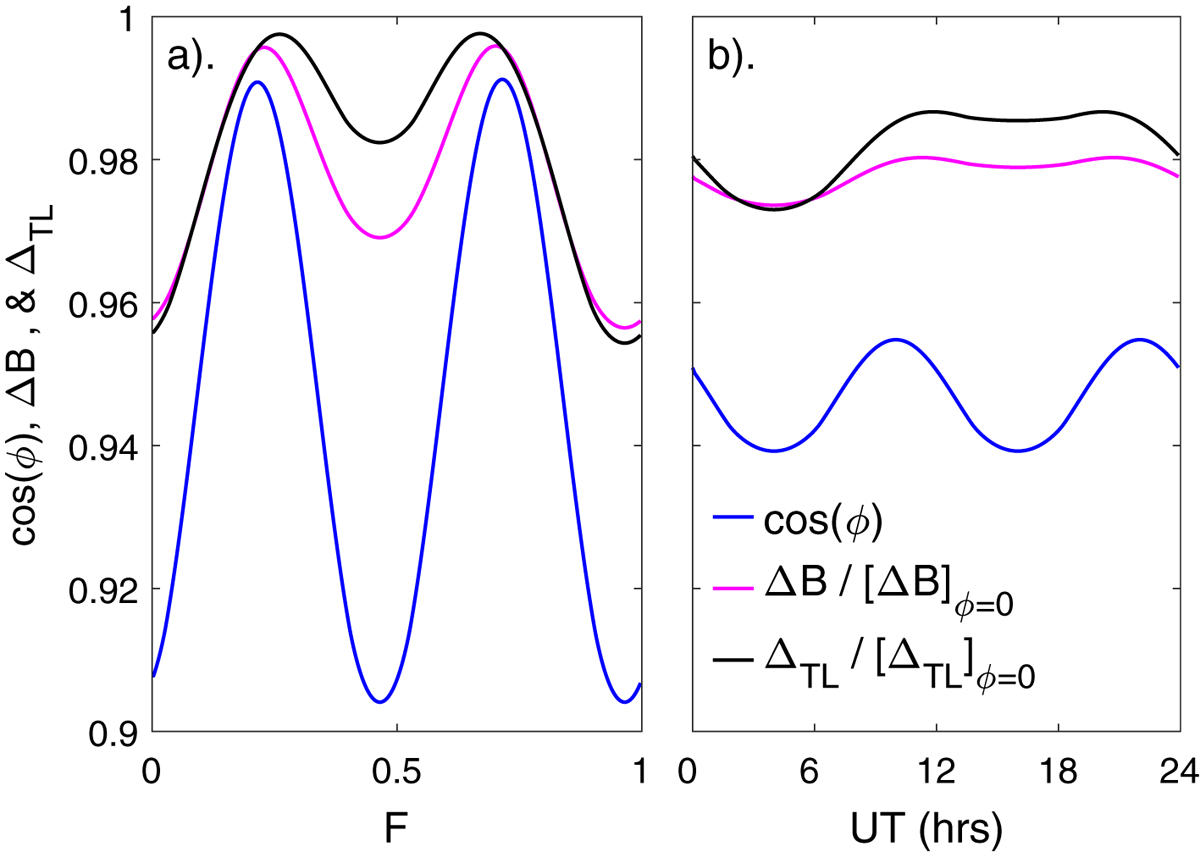
Average variations with (a) time-of-year, F, and (b) Universal Time, UT. The blue lines are for the cosine of the angle tilt angle ϕ, the mauve lines are for the magnetic shear across the hinge point in the tail, ΔB, and the black line is the fractional increase in total energy in the tail (between X GSE = −5 R E and X GSE = −50 R E) for IMF B z of −6 nT compared to zero IMF B z, ΔTL. For ΔB and ΔTL two features are seen that are found in geomagnetic data (see Fig. 15 of Paper 2) but are not present in the cos(ϕ) variation: (1) in the F variation, the December minimum is deeper than the June minimum; (2) the UT variation shows a minimum at 0-8 UT. Both are consequences of the hemispheric asymmetry in the magnetopause model which arises from the hemispheric asymmetry in the geomagnetic field.
Current usage metrics show cumulative count of Article Views (full-text article views including HTML views, PDF and ePub downloads, according to the available data) and Abstracts Views on Vision4Press platform.
Data correspond to usage on the plateform after 2015. The current usage metrics is available 48-96 hours after online publication and is updated daily on week days.
Initial download of the metrics may take a while.