Fig. 9
Download original image
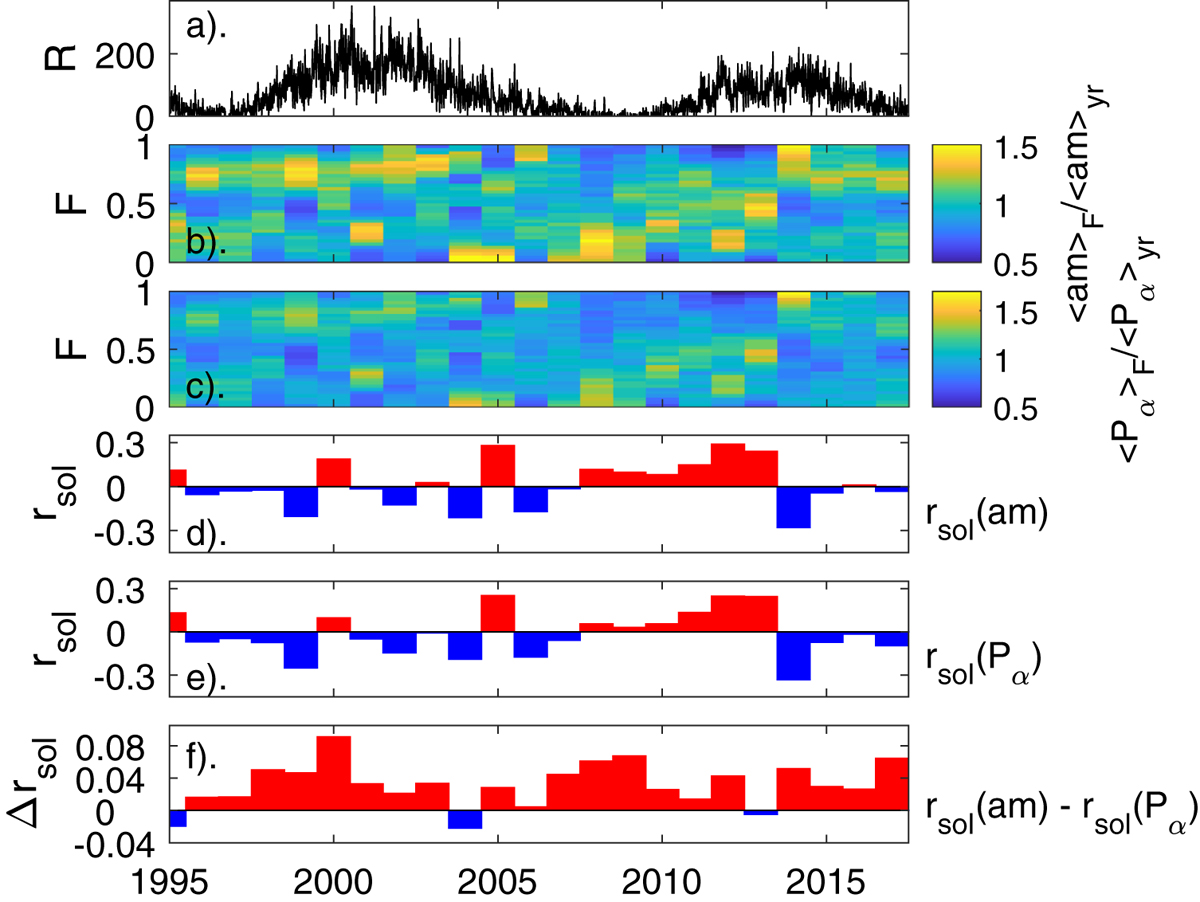
The annual variations of observed am index and inferred power input to the magnetosphere, P α , comparing the solstices in particular. (a) the daily sunspot number, R; (b) the normalised average am index 〈am〉F/〈am〉yr, where 〈am〉F is the average am in 36 equal-bin widths of fraction of year, F, in each year and 〈am〉yr is the average am for that year, color-coded as a function of F and year; (c) the corresponding plot for the power input to the magnetosphere 〈P α 〉F/〈P α 〉yr; (d) a comparison of the means of am in quarter-year intervals around the June and December solstices, 〈am〉jun and 〈am〉dec respectively: the annual value of the ratio r sol(am) is plotted as red/blue bars for years when it was positive/negative, respectively, where r sol(am) = (〈am〉jun − 〈am〉dec)/(〈am〉jun + 〈am〉dec); (e) a comparison of the corresponding ratio for power input to the magnetosphere r sol(P α ) = (〈P α 〉jun − 〈P α 〉dec)/(〈P α 〉jun + 〈P α 〉dec). (f) shows the difference, r sol(am) − r sol(P α ).
Current usage metrics show cumulative count of Article Views (full-text article views including HTML views, PDF and ePub downloads, according to the available data) and Abstracts Views on Vision4Press platform.
Data correspond to usage on the plateform after 2015. The current usage metrics is available 48-96 hours after online publication and is updated daily on week days.
Initial download of the metrics may take a while.