Fig. 1
Download original image
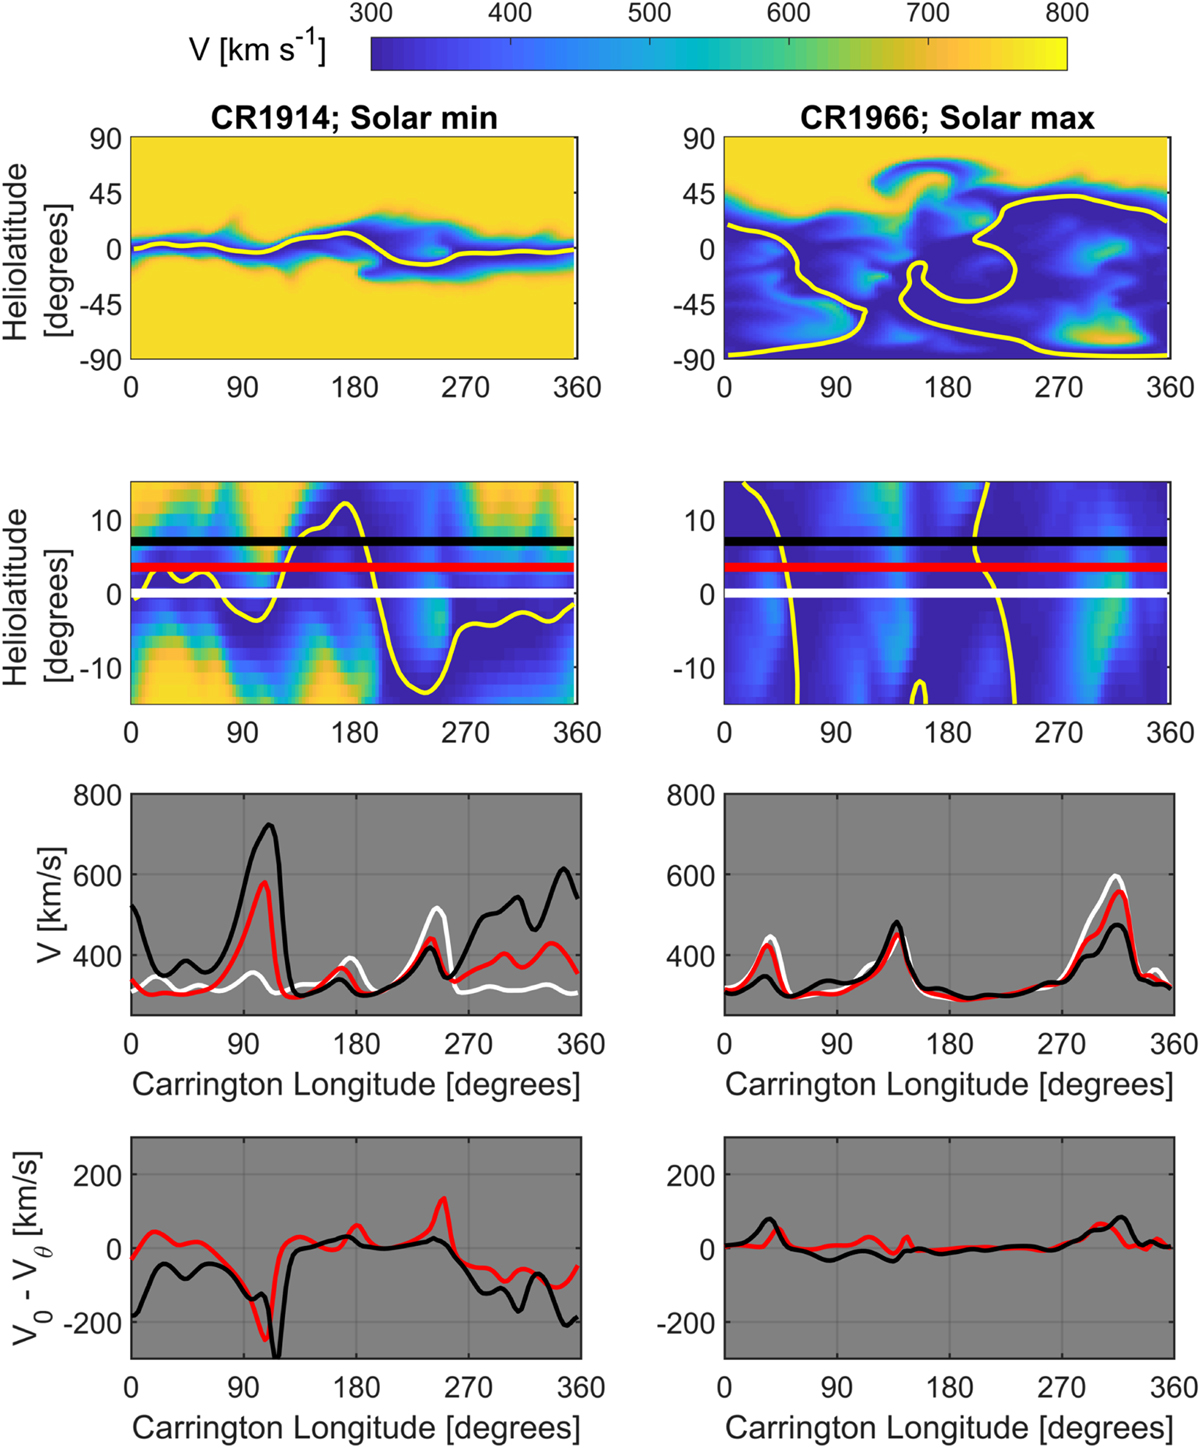
Examples of model 1-AU solar wind structure at solar minimum (left) and solar maximum (right). Top: solar wind speed at 1 AU as a function of latitude and longitude. The yellow curve shows the heliospheric current sheet. Second row: same as top, but a zoom in of 15° about the heliographic equator. White, red, and black horizontal lines show 0°, 3.5°, and 7° latitude, respectively. Third row: solar wind speed at the three highlighted latitudes, in the same format. Bottom: the difference in solar wind speed between a given latitude and the equator. Figure adapted from Owens et al. (2019a).
Current usage metrics show cumulative count of Article Views (full-text article views including HTML views, PDF and ePub downloads, according to the available data) and Abstracts Views on Vision4Press platform.
Data correspond to usage on the plateform after 2015. The current usage metrics is available 48-96 hours after online publication and is updated daily on week days.
Initial download of the metrics may take a while.