Fig. 2

Download original image
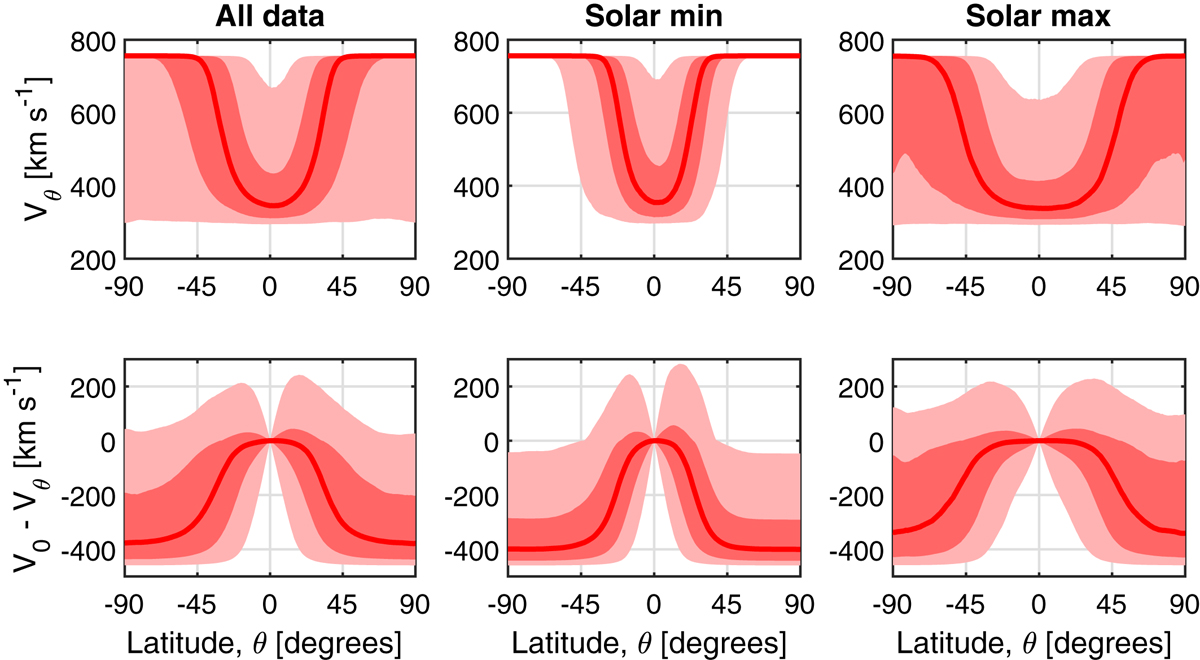
Top: the distributions of Vθ, the solar wind speed at 1 AU, as a function of heliographic latitude, θ, for 40+ years of model results. The red line shows the median, the dark-pink shaded region spans the 25–75 percentiles of the distribution (i.e., the inter-quartile range), while the light-pink regions spans 5–95 percentiles of the Vθ distribution. Panels, from left to right, show the whole dataset, solar minimum, and solar maximum periods, respectively. Bottom: the distributions of the difference in solar wind speed at a given latitude to that at the equator, i.e. V0−Vθ, as a function of θ. In the same format as the top panels.
Current usage metrics show cumulative count of Article Views (full-text article views including HTML views, PDF and ePub downloads, according to the available data) and Abstracts Views on Vision4Press platform.
Data correspond to usage on the plateform after 2015. The current usage metrics is available 48-96 hours after online publication and is updated daily on week days.
Initial download of the metrics may take a while.


