Fig. 5
Download original image
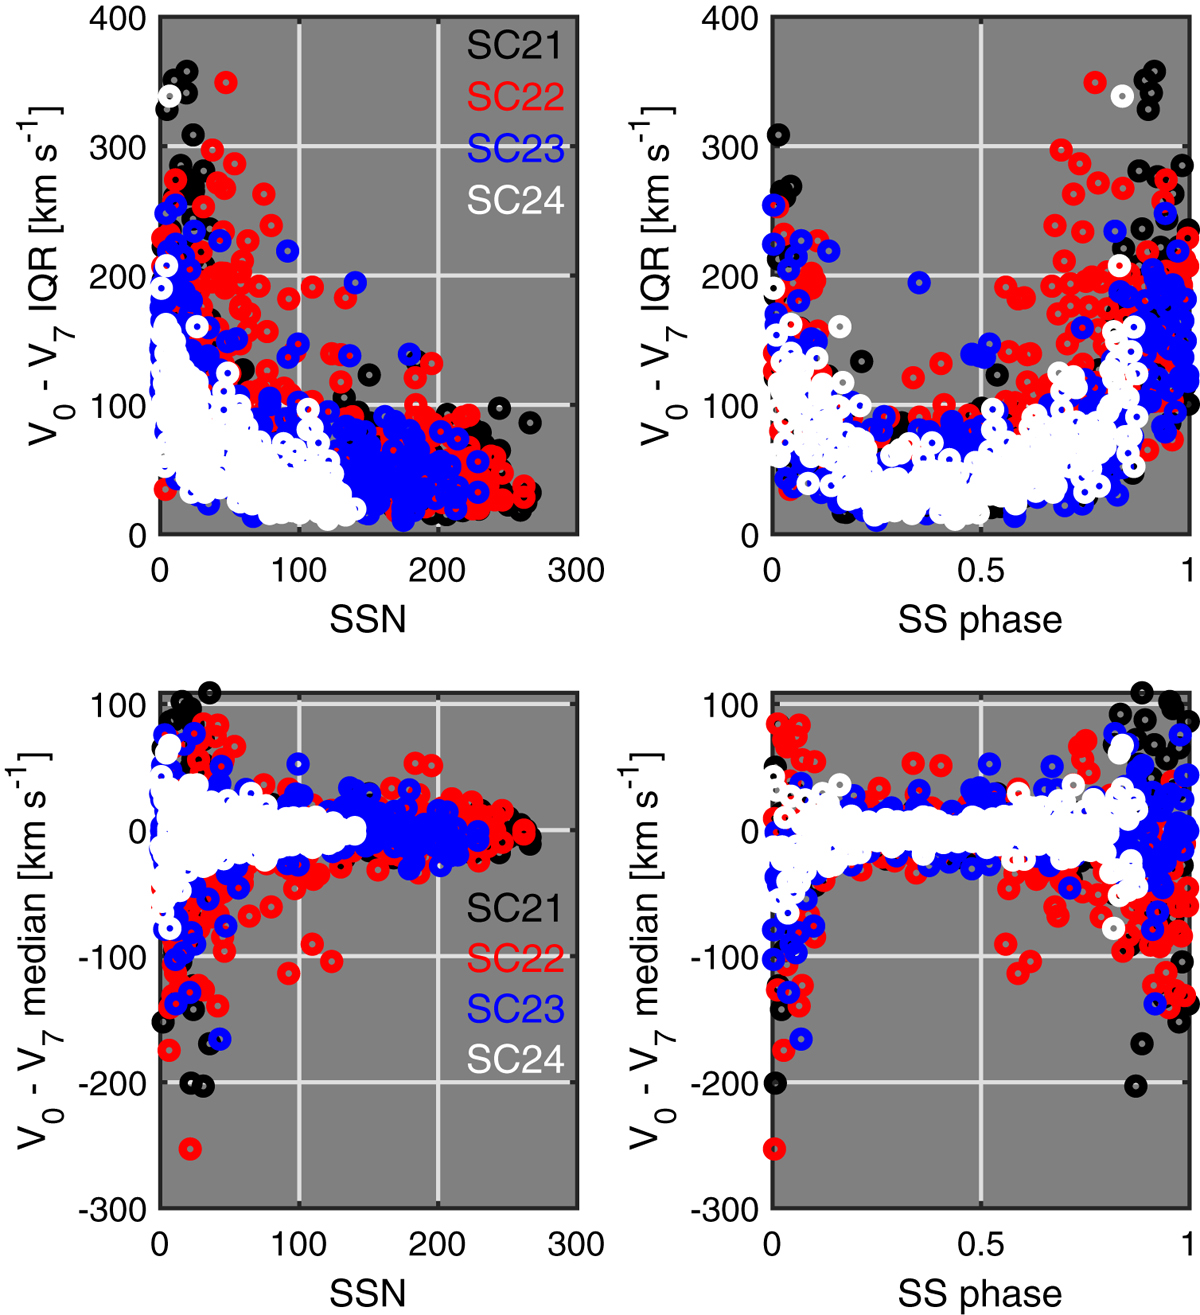
Scatter plots of 1-CR averages of V0−V7, the solar wind speed difference between the equator and 7° latitude, with solar activity. Top: the inter-quartile range of V0−V7 as a function of sunspot number (left) and sunspot cycle phase (right), where solar minimum is 0 and 1, and solar maximum is approximately 0.5. Bottom: the median of V0−V7 as a function of sunspot number (left) and sunspot cycle phase (right). In all panels, solar cycles 21, 22, 23, and 24 have been coloured black, red, blue, and white, respectively.
Current usage metrics show cumulative count of Article Views (full-text article views including HTML views, PDF and ePub downloads, according to the available data) and Abstracts Views on Vision4Press platform.
Data correspond to usage on the plateform after 2015. The current usage metrics is available 48-96 hours after online publication and is updated daily on week days.
Initial download of the metrics may take a while.