Fig. 7
Download original image
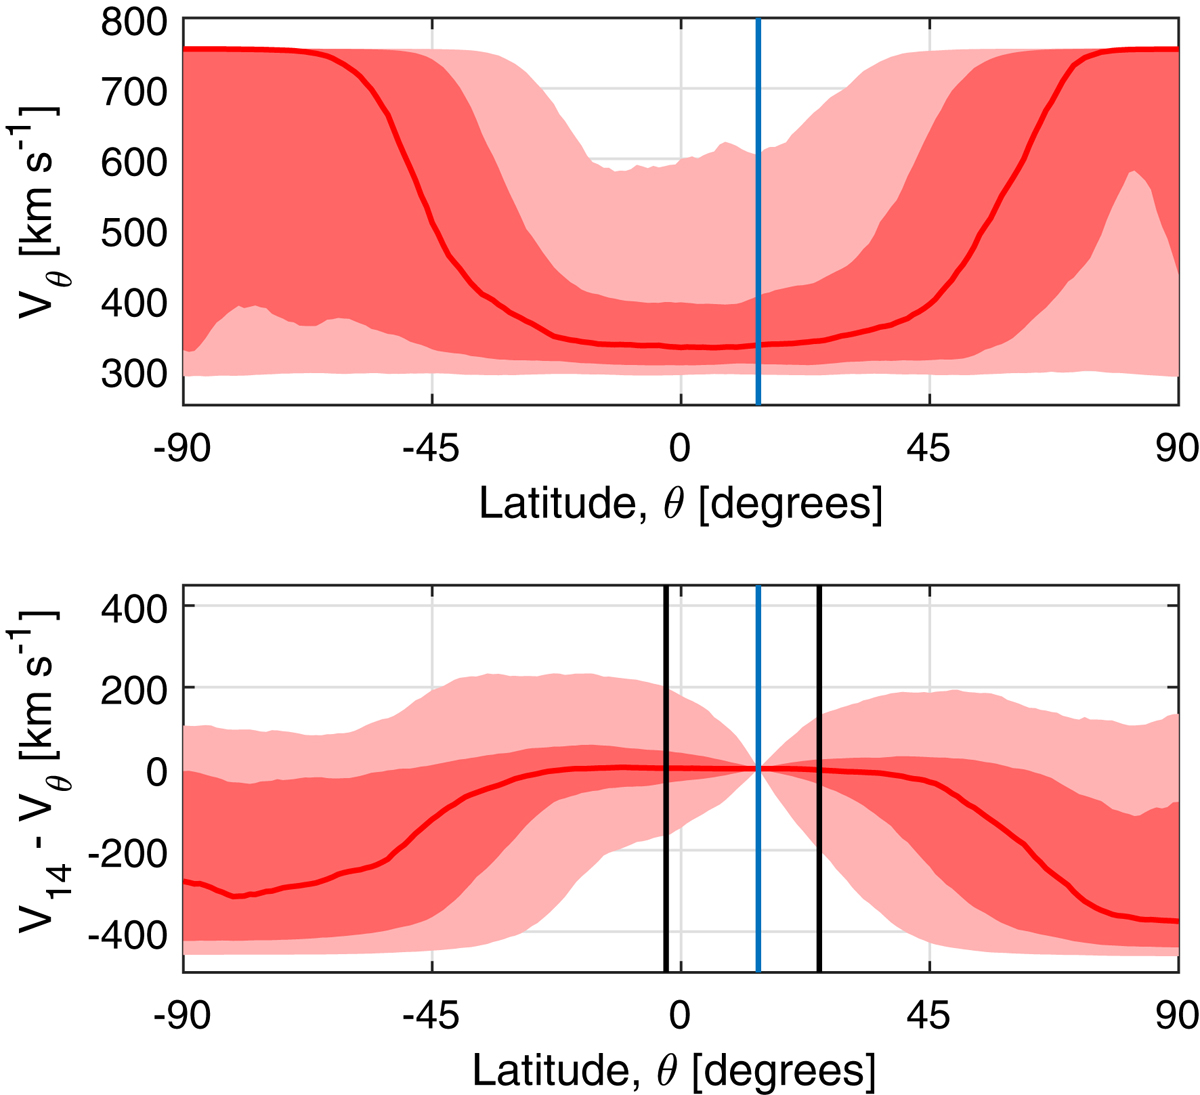
Determining the localisation parameter, λ, at a latitude of 14°, the vertical blue line. Top: the distribution of solar wind speeds as a function of latitude for an interval close to solar maximum (solar cycle phase between 0.4 and 0.5). The red line shows the median, the dark-pink shaded region spans the 25–75 percentiles of the distribution (i.e., the inter-quartile range), while the light-pink regions spans 5–95 percentiles. Bottom: the distribution of V14−Vθ, speed differences between 14° latitude and θ. The vertical black lines show the latitudes where either the 5 or 95 percentiles of the V14−Vθ distribution first exceed VTOL = 200 km s−1 in magnitude.
Current usage metrics show cumulative count of Article Views (full-text article views including HTML views, PDF and ePub downloads, according to the available data) and Abstracts Views on Vision4Press platform.
Data correspond to usage on the plateform after 2015. The current usage metrics is available 48-96 hours after online publication and is updated daily on week days.
Initial download of the metrics may take a while.