Open Access
Fig. 10
Download original image
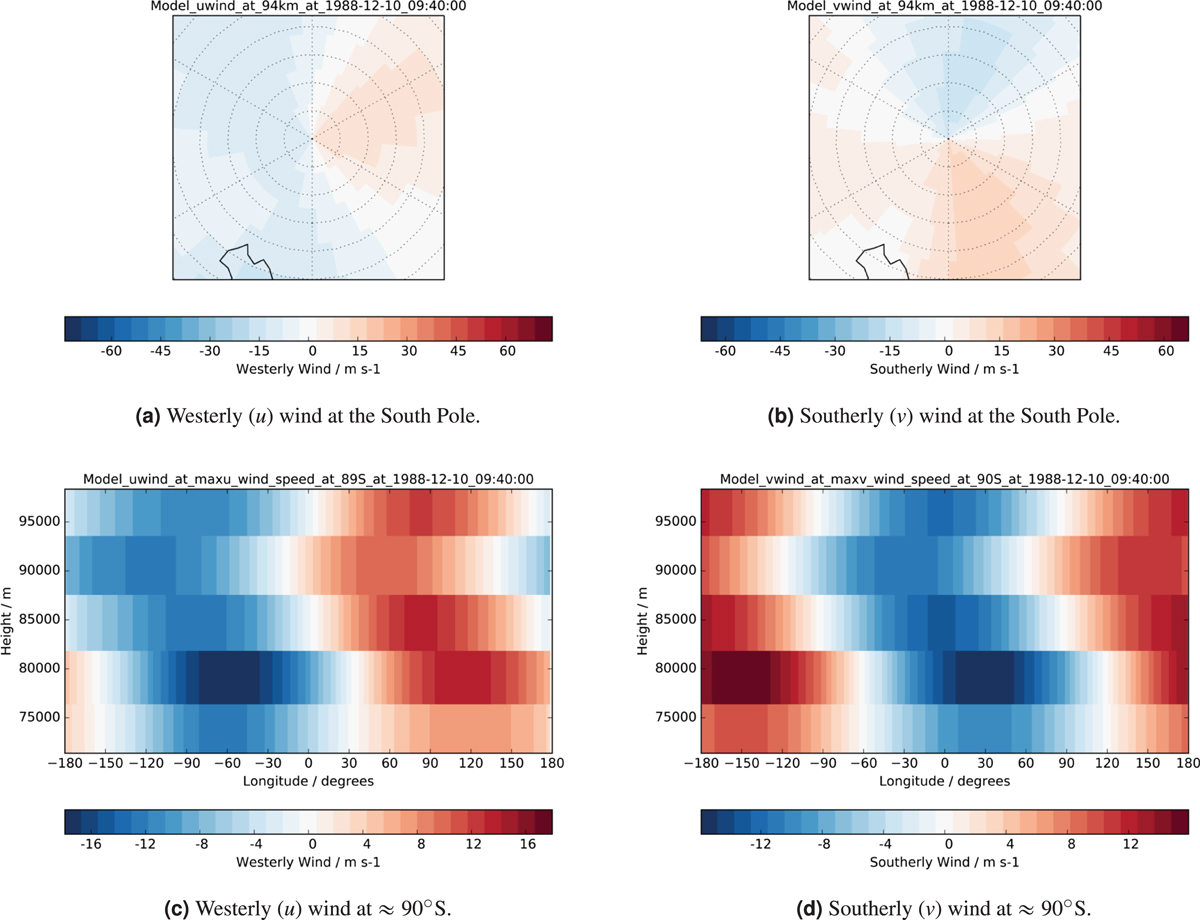
Modelled wind in the 100 km September model run with the nudging scheme in place. Stereographic plots at the uppermost model level (a) and (b). Plots of the wind at the southernmost latitude circle (c) and (d). We see the removal of the anomalous wind speeds present previously by comparison with Figure 5.
Current usage metrics show cumulative count of Article Views (full-text article views including HTML views, PDF and ePub downloads, according to the available data) and Abstracts Views on Vision4Press platform.
Data correspond to usage on the plateform after 2015. The current usage metrics is available 48-96 hours after online publication and is updated daily on week days.
Initial download of the metrics may take a while.