| Issue |
J. Space Weather Space Clim.
Volume 10, 2020
|
|
|---|---|---|
| Article Number | 20 | |
| Number of page(s) | 9 | |
| DOI | https://doi.org/10.1051/swsc/2020022 | |
| Published online | 09 June 2020 | |
Research Article
Further complexities on the pre-reversal vertical drift modeling over the Brazilian region: A comparison between long-term observations and model results
1
Instituto Tecnológico de Aeronáutica (ITA), São José dos Campos, SP 12228-900, Brazil
2
Instituto Nacional de Pesquisas Espaciais (INPE), São José dos Campos, SP 12227-010, Brazil
* Corresponding author: This email address is being protected from spambots. You need JavaScript enabled to view it.
Received:
2
January
2020
Accepted:
18
May
2020
Abstract
The vertical component of the plasma drift, especially the evening-time pre-reversal drift, constitutes an important aspect of the nighttime electrodynamics of the equatorial ionosphere. Over the years, several studies using measurements and models have been performed to understand the characteristics of this process and its implications for the development of the instabilities leading to the plasma bubble formation and ionospheric scintillation. However, the Brazilian region presents some unique features that bring some difficulties for the vertical drift prognosis, which is required for the scintillation forecasting. These features are mainly related to the geomagnetic field lines topology that presents strong differences when compared to those of other equatorial longitudes. In this work, some of the difficulties for the pre-reversal vertical drift modeling and estimation are discussed; also, a dataset containing long-term observation (2001–2009) is compared with a widely used empirical model. The results show an intrinsic trend of underestimation by the model, which seems to be independent of latitude and seasonality thus suggesting an additional contribution arising from sources other than solely the geomagnetic topology. Also, the results indicate that the deviation can vary in the range of 0–40 m/s and the percentage error enhances with increasing values of pre-reversal vertical drift peak and reduces with increasing F10.7 values, thereby, indicating a clear possibility of meridional winds contribution which is not included in the empirical model used and may account for these differences.
Key words: Pre-reversal vertical drift / Equatorial plasma electrodynamics / Ionospheric modeling
© J. Sousasantos et al., Published by EDP Sciences 2020
 This is an Open Access article distributed under the terms of the Creative Commons Attribution License (https://creativecommons.org/licenses/by/4.0), which permits unrestricted use, distribution, and reproduction in any medium, provided the original work is properly cited.
1 Introduction
The vertical component of the plasma drift is the prime mover of the phenomenology of the nighttime ionosphere over the equatorial and low-latitude regions. This vertical plasma drift is responsible for the transport of the plasma across the geomagnetic field lines resulting in a redistribution of the electron density with latitude around the geomagnetic equator. Moreover, during its evening pre-reversal stage, certain values of the vertical drift impose a condition sine qua non for the development of instabilities and the subsequent rising of Equatorial Plasma Bubbles (EPBs) which may, in turn, cause scintillation in transionospheric radio signals (Abdu et al., 2009).
As a consequence, any forecasting scheme for predicting the occurrence of EPBs or ionospheric scintillation must rely on some knowledge about the behavior of the evening-time pre-reversal vertical drift (PRVD) that sets the conditions for scintillation occurrence.
Along the years many studies concerning the PRVD features were published either using ionospheric sounding data or numerical modeling. Abdu et al. (1981) using ionosonde data from Fortaleza (geographic longitude: 38° W) and Jicamarca (geographic longitude: 77° W) showed that the pre-reversal vertical drift magnitude is largely dependent on the magnetic declination angle, which varies with longitude. Over the Brazilian region, the magnetic field declination is westward and attains the largest values within all equatorial extension, thus requiring additional efforts in the vertical drift modeling task.
Batista et al. (1986) compared the vertical drift obtained from ionosonde data over two stations with manifestly different magnetic declination angle, namely, Fortaleza (geographic longitude: 38° W; magnetic dip: −2°; magnetic declination: 21° W) in the Brazilian territory and Huancayo (geographic longitude: 75° W; magnetic dip: 0.6°; magnetic declination: 3° E) in the Peruvian territory. Further, they developed a numerical simulation code that was used to discuss the longitudinal and seasonal asymmetries in the PRVD, exploring this distinct behavior over the Brazilian region. They found that the magnetic declination and the thermospheric winds are the major factors controlling this asymmetric behavior (see Fig. 4 in their paper). Some more works on the vertical drift modeling and other aspects are presented by Abdu et al. (1992), Tsunoda (1985), Pingree & Fejer (1987), Fejer et al. (1991, 1995), Batista et al. (1996), de Medeiros et al. (1997), Scherliess & Fejer (1999), Fesen et al. (2000), Souza et al. (2000), Fejer et al. (2008, 2014), Alken (2009), and Santos et al. (2013).
Among all the models already proposed, the most widely used/mentioned is the Scherliess & Fejer (1999) empirical model, which uses radar and satellite measurements to describe the F region vertical drift on a global scale. It has been used, for instance, as input for most of the general ionospheric models such as the SAMI2 (SAMI2 is another model of the Ionosphere) (Huba et al., 2000) and the Sheffield University Plasmasphere Ionosphere Model (SUPIM) (e.g., Bailey et al., 1997; Bravo et al., 2017, 2019).
For historical reasons, most of these models and comparisons with data mentioned above usually refer to Jicamarca radar measurements and show remarkable correspondence. Notwithstanding, over the Brazilian region the picture is slightly different, because of the large geomagnetic declination angle, as mentioned before (e.g. Abdu et al., 1981, 1992; Tsunoda, 1985; Batista et al., 1986, 1996) and other factors to be addressed further in this work. The Scherliess & Fejer (1999) vertical drift model, henceforth referred as SF1999, which is the most widely used vertical drift model, is also based largely on Jicamarca radar data, thus, some deviation may be expected when this model is used for the description of certain phenomenon over the Brazilian region. The SF1999 model is complemented at other longitudinal sectors with ion drift meter data from AE-E satellite, and for this, the cubic-B spline description of local time and longitudinal dependencies with four nodal points is considered. These nodes are defined at 0°, 90°, 180°, and 270°, so that the Brazilian territory is placed inside the bin from the Pacific to the Atlantic oceans. Figure 1 illustrates the region inside this node (delimitated by the vertical dashed white lines). The colored thick line along the map represents the geomagnetic equator, and the colors describing the curve correspond to the values of the geomagnetic declination angle along the equator. The values of the geomagnetic declination range from ~ −19° W (dark red) to 10° E (dark blue) and were obtained from the IGRF-12 model (Thébault et al., 2015). IGRF-12 model may be accessed at https://ccmc.gsfc.nasa.gov/modelweb/models/igrf_vitmo.php. The symbols in the figure indicate the stations already mentioned or to be cited along this manuscript, namely, Fortaleza (∆), Jicamarca (pentagon), Huancayo (plus signal), Cachimbo (X), Boa Vista (o), Campo Grande (∇), and São Luís (square).
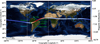 |
Figure 1 Global profile of the declination (colors) along the geomagnetic equator (curve) showing the larger declination (red) over the Brazilian region. The dashed line delimitates the region between 90° W and 0° (i.e., 270°–0°). The green symbols indicate the location of some stations that are mentioned along the text. |
The point to be emphasized in Figure 1 is that along the geomagnetic equator, the values of declination are very close to that of Jicamarca, except in the Brazilian territory, where the declination presents a completely different feature, with larger values. Hence, a given model such as the SF1999 which uses Jicamarca data may represent very coherently the behavior of the pre-reversal vertical drift along the globe, except over the Brazilian region, where some discrepancies might be present.
In the next sections, some of the difficulties experienced in the pre-reversal vertical drift modeling are discussed. Using long-term ionosonde data from Brazilian stations, the values of the PRVD peak velocities (Vzp) are calculated and compared with the SF1999. The results suggest that the SF1999 usually underestimates the pre-reversal vertical drift peak velocity over the Brazilian region in most of the scenarios.
2 Conjugate asymmetry of the vertical drift within the same geomagnetic meridional plane
Abdu et al. (2009) presented some remarkable results obtained during the Conjugate Point Equatorial Experiment (COPEX) campaign. Among their several results one that is noteworthy in the context of the discussion presented here, is that besides the longitudinal asymmetries, the vertical drift over the Brazilian region was also found to vary between magnetic conjugate locations. During COPEX campaign (in 2002) ionosondes were deployed at magnetic conjugate stations and at magnetic equator, namely, Boa Vista (2.8° N, 60.7° W, magnetic latitude: 11°, green circle in Fig. 1) in the northern hemisphere and Campo Grande (20.5° S, 54.7° W, magnetic latitude: −11°, green nabla in Fig. 1) in the southern hemisphere and at the equatorial site Cachimbo (9.5° S, 54.8° W, magnetic latitude: −2°, green X in Fig. 1). Figure 2 exhibits three panels summarizing the results of the vertical drifts obtained during the campaign period (that lasted 66 days). Panels (a), (b), and (c) show the values obtained at Cachimbo (equatorial station), Campo Grande (southern conjugate point) and Boa Vista (northern conjugate point), respectively, during evening-early night period. The gray lines represent the vertical drift on individual days while the superposed red line is the average of all these values. The data was registered between 10/05/2002 and 12/09/2002 (mm/dd/yyyy format), which comprises equinox and summer/winter solstice period in the southern/northern hemisphere.
 |
Figure 2 Vertical drifts calculated through ionosonde data for the equatorial station, Cachimbo (left panel), and conjugate point stations at southern (middle panel) Campo Grande and northern hemisphere (right panel) Boa Vista. More details on this calculation are given in Abdu et al. (2009). |
The pre-reversal vertical drift over Cachimbo was stronger than that at the low latitude conjugate sites, as to be expected; however, the conjugate points do not behave in a symmetric way. In fact, the southern station presented larger Vzp values in 78.2% of the dataset as can be clearly noted by comparing middle and right panels in Figure 2.
This asymmetry is not due to the topology of the geomagnetic field declination, once both conjugate points present similar declination (−14° and −15.1° over Boa Vista and Campo Grande, respectively). Instead, Abdu et al. (2009) explain such variation in terms of a northward trans-equatorial (i.e., meridional) wind. Otherwise the plasma motions caused by large scale electric fields should be equivalent in both hemispheres. These trans-equatorial winds are found to present a large day-to-day variability. As a result, the lack of a more precise model or a large dataset from conjugate points in the Brazilian region brings in some difficulties in the development of adjustments.
3 Differences between theoretical and measured off-equator values of the Vzp
If vertical drift data from an equatorial station is available, a theoretical approach may be applied to estimate the values at off-equator latitudes. On the basis of considerations of field line mapping, assuming a dipole approximation, a purely zonal electric field generated vertical drift, as in the case of the PRVD, may be expressed as a function of geomagnetic latitude (θ) in the form of:  , where
  (e.g. Kendall, 1962). In this equation,
  corresponds to the value of the vertical drift over the dip equator and
  its values over a given off-equatorial latitude θ. An example of this procedure is presented in Figure 3, wherein the values of Vzp over Campo Grande (off-equator), obtained from ionosonde during COPEX campaign, are compared with theoretical Vzp values calculated using the expression for δ and the Vzp values obtained from ionosonde over the equatorial station of Cachimbo.
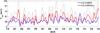 |
Figure 3 Comparison between the values of Vzp obtained over Campo Grande. Ionosonde measured values are presented in blue (CG-COPEX), and theoretical Vzp values are presented in red [CG-COPEX(δ)]. The theoretical Vzp values were obtained using the values from ionosonde data over Cachimbo equatorial station and the expression for δ. The gray dashed curve corresponds to the Vzp obtained from ionosonde over Cachimbo and is provided for reference. |
The blue curve (CG-COPEX) corresponds to the Vzp values obtained from the ionosonde measurements over Campo Grande (dip latitude: −22.3°), and the red curve [CG-COPEX (δ)] to theoretical Vzp values calculated over CG using those obtained from the ionosonde measurements over Cachimbo (equatorial station) and the theoretical expression  , with θ = −22.3°.Additionally, the gray dashed curve presents the values obtained from the ionosonde measurements over Cachimbo (equatorial station), that is,
  for all the COPEX days for reference.
As can be clearly noticed, this approach using  overestimates the values of the
  for Campo Grande in the large majority of the days (for 83.33% of the dataset). In the Brazilian territory the ionosondes are, most of the time, deployed at off-equator stations, hence, the theoretical expression may be inverted to estimate equatorial PRVD peak, i.e.,
  . These off-equator locations are mostly due to the rapid changes of the geomagnetic field along the Brazilian territory. However, as a consequence of the results presented in Figure 3, the values obtained for
  probably will be underestimated and this must be considered in any model for representing the vertical drift over the Brazilian region using ionosonde data from off-equator latitudes.
4 Comparison between SF1999 model (SAMI2) and long-term data over Brazilian region
As mentioned in the previous sections, there are some difficulties in the task of pre-reversal vertical drift modeling over the Brazilian region either using empirical or theoretical approaches. Among the modeling developments along the years, the most widely used is the SF1999 empirical model (Scherliess & Fejer, 1999), cited by over 500 papers up to present date. This model uses a combination of the Jicamarca (green pentagon in Fig. 1) incoherent scatter radar and Atmospheric Explorer E (AE-E) satellite ion drift meter data that were applied to a Cubic-B spline interpolation. The Jicamarca incoherent scatter radar data included 502 days of observations (during the period of 1968–1992), and the AE-E data were collected along a period of ~3 years (01/1977–12/1979). The data were divided into four groups with longitudinal nodes located at 0°, 90°, 180° and 270°. Accordingly, the Brazilian region is contained in the longitudinal set that comprises the Pacific-American sector (denoted by white dashed vertical lines in Fig. 1). The longer period of the Jicamarca data set in comparison with the data period covered by the AE-E satellite, and the way in which the four longitudinal sets were defined, probably will imply better agreement of the model values with Peruvian sector data or other places with similar geomagnetic topology as previously mentioned.
A preliminary comparison between the values of Vzp calculated from ionosonde data over Cachimbo, during COPEX campaign, and the SF1999 values for the same location, as obtained using the SAMI2 model, reveals that the model underestimates the values on 95.38% of the days with a slight trend of increase in the errors as the data advances from equinox to summer solstice (southern hemisphere). This result was obtained considering the ratio between the number of days with underestimation and the total number of days in the dataset. The increasing trend was found through a linear regression. These results are summarized in Figure 4, where ∆Vzp = Vzp(COPEX) − Vzp(SF1999) are represented by colored circles with values increasing from blue to red. The red dashed line represents the equivalence level between model and data (i.e., ∆Vzp = 0), and the black solid line corresponds to a first order polynomial approximation, which elucidates the slight increase according to seasonal change. Based on these preliminary results, which refer exclusively to a solar maximum period, an investigation with longer dataset seems to be desirable in order to investigate how these discrepancies behave under different solar conditions. However, being the solar flux used in model the same from the dataset, hence not a direct agent of the deviations, the following investigation intends to verify what are the parameters involved in controlling the magnitude of such errors, that is, in the augmentation or reduction of the errors.
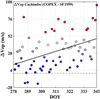 |
Figure 4 ∆Vzp (COPEX-SF1999) over Cachimbo. The colored circles represent, from blue to red, increasing values of ∆Vzp. The red dashed line corresponds to ∆Vzp = 0, and the black solid line indicates the trend of increase in the errors with seasonal transition (equinox-summer solstice). |
For the sake of a more detailed comparison, a broader set of ionosonde calculated Vzp values, covering a period from maximum to minimum solar conditions (2001–2009) over two stations was used to juxtapose with the SF1999 (SAMI2). The equatorial station of São Luís (2.6° S, 44.7° W, dip latitude: −0.80° to −2.22°, green square in Fig. 1) and the low latitude station of Fortaleza (3.72° S, 38.53° W, dip latitude: −5.14° to −6.59°, green triangle in Fig. 1) were chosen because a large dataset covering the same equinox-summer solstice transition period (October–December) was available at both stations. This dataset corresponds to geomagnetic quiet conditions in order to minimize the number of parameters that may cause deviations from expected values. The number of days complying this condition was 460 and 601 for São Luís and Fortaleza stations, respectively. The Vzp was calculated considering an average of the real height of the F layer (hF) for the specific frequencies of 5 and 6 MHz. The effects of recombination for the cases when the hF was below 300 km were taking in account in the calculation of the Vzp. The recombination effect was retained though a term βH, where β is the loss coefficient, and H is the scale height, i.e., Vz = d(hF)/dt − βH. The calculation of βH is performed assuming the neutrals O2 and N2 in the O+ loss processes, i.e., β = k1[N2] + k2[O2]. The rates k1 and k2 are related to the reactions O+ + N2 → NO+ + N and O+ + O2 → O2+ + O, respectively. According to Anderson & Rusch (1980) these rates can be assumed as k1 = 7 × 10⁻¹³ cm3/s and k2 = 2 × 10⁻¹¹(Tn/300)−1/2 cm3/s, where Tn is the neutral temperature. The values for O2, N2 and Tn were obtained through the MSISE-90 model (Hedin et al., 1991). The values of H were calculated according to H = Ne(dh/dNe), where Ne and h are the electron density and altitude of the F layer.
Figure 5 shows the Vzp values calculated from the available ionosonde data (black line) over São Luís (a) and Fortaleza (b) stations for the years from 2001 to 2009, and the SF1999 model (red line). The number of days available in the dataset for each of the years is exhibited in the upper right region of the panels. Some lacks of data occurred during the years of 2007 and 2008 for São Luís station and in 2002 for Fortaleza.
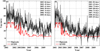 |
Figure 5 Vzp values as calculated from ionosondes data (black lines) and obtained from SF1999 model (red lines) for São Luís (a) and Fortaleza (b) stations. The data comprises from maximum to minimum of the solar cycle 23. |
The results based on SF1999 (red lines in Figure 5) were obtained using the exact values of F10.7 and geomagnetic indexes (ap index is used in SAMI2) for each day. Notwithstanding, the values are underestimated in the large majority of the days for both, equatorial (a) and low-latitude (b) stations, as may be clearly verified by investigating the Figure 5.
The decrease in the magnitudes along the years in both cases (data and model) is controlled by the solar activity decline from 2001 up to 2009. The dominance of the solar conditions over the equatorial pre-reversal vertical drift intensity was already explored by other works (e.g. Abdu et al., 2010; Santos et al., 2013).
In order to verify explicitly the differences between the SF1999 results and the ionosonde calculated Vzp values, a day-by-day ∆Vzp for each of the stations, São Luís (SL-SF1999) and Fortaleza (FZ-SF1999), was calculated and is presented in Figure 6. The results are plotted as a function of the day of the year (DOY) in order to verify if some seasonal trend may exist. The colored circles correspond, from blue to red, to increasing values of ∆Vzp, and the red line indicates the level in which SF1999 results and ionosonde calculated Vzp values are the same (i.e., ∆Vzp = 0). As already pointed out by the results in Figure 5, the ∆Vzp values are predominantly positive, meaning an underestimation of the SF1999 (e.g., SL-SF1999 > 0 ⟹ SL > SF1999). This difference seems to vary mainly in the range 0–40 m/s, which is a large deviation. Moreover, these differences occurred in the entire period, without any explicit seasonal tendency, which is unexpected to some extent, once the unequal magnetic declination would suggest an increase in ∆Vzp for later DOY (Abdu et al., 1981).
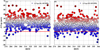 |
Figure 6 ∆Vzp calculated for the equatorial São Luís (a) and the low-latitude Fortaleza (b) stations. The colored circles indicate, from blue to red, increasing values of ∆Vzp. In both stations SF1999 underestimated the values for the large majority of the days (i.e., ∆Vzp > 0). |
According to the results, the SF1999 empirical model presents a continuous and consistent underestimation of Vzp over the Brazilian sector. This underestimation apparently is not merely related with seasonal, magnetic declination, or solar flux conditions, instead it seems to be, somehow, an inherent feature.
In order to derive more information in an attempt to clarify the reasons for this underestimation we analyze the statistical distribution of the ∆Vzp. The percentage error ζ between SF1999 and the ionosonde calculated Vzp values was used for this investigation, i.e.,  , and its values (numbering 460 and 601 for São Luís and Fortaleza stations, respectively) were arranged in 60 bins.
With the values of ζ a more detailed procedure is to produce a bivariate histogram (60 bins in each dimension are assumed) in which two distinct parameters are considered to collate with ζ, namely, the ionosonde calculated Vzp values (for both stations) and the F10.7 values (the ranges assumed were 0 ≤ |∆Vzp| ≤ 100 m/s and 0 ≤ F10.7 ≤ 300 s.f.u.).
Figure 7 exhibits four panels wherein the results are grouped in such a way that the bivariate histograms related to the equatorial station, São Luís, considering the ionosonde calculated Vzp values and the F10.7 index, are presented in the panels (a) and (b), respectively. In the case of the low-latitude station, Fortaleza, same disposition was used in the panels (c) and (d). The color bar indicates the frequency, i.e., the number of occurrences, which increases from blue to red colors.
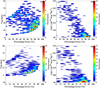 |
Figure 7 Bivariate distribution of ζ for the Vzp values obtained from ionosonde data for São Luís and for the F10.7 index (panels a and b) and similar results for Fortaleza (panels c and d) stations, respectively. |
First, considering the results of the Vzp as obtained from ionosonde data as a parameter, that is, panels (a) for São Luís station and (c) for Fortaleza station, it is possible to argue that the percentage error (ζ) presents, for both stations, a trend for enhancement as the real Vzp values increase. However, the larger majority of ζ does not concentrates in the regions of larger real Vzp values, but instead in the ranges of ~10–40 m/s for the equatorial São Luís station (a), and ~5–25 m/s for the low-latitude Fortaleza station (c). When F10.7 is used as a parameter, i.e., panels (b) and (d) for São Luís and Fortaleza stations, respectively, it is possible to realize that the percentage error (ζ) presents a trend of increase according to decreasing values of F10.7 for both stations. The larger concentration of the occurrences of ζ, for both stations, was found to be restricted to within the range: 66 ≤ F10.7 ≤ 100 s.f.u.
The increase of the percentage error in case of larger values of Vzp indicates that the SF1999 usually presents more modest values, and that over the Brazilian region the Vzp may attain larger values than over the Peruvian region, where most of the data used in SF1999 were collected. The larger percentage error in case of lower F10.7 suggests a substantial role of the meridional winds that may change the vertical drift pattern.
It must be noticed that while the increase (decrease) in the percentage error according to enhancement of the Vzp (F10.7) values is a very expressive result, the frequency of occurrences is, probably, an intrinsic consequence of the dataset statistical distribution which behaves exactly in the manner as may be verified in Figure 8.
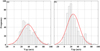 |
Figure 8 Statistical distribution of Vzp obtained through sounding data over São Luís (panel a) and Fortaleza (panel b) stations. |
As can be clearly noted, the values of Vzp typically concentrate around 40 m/s and 25 m/s for São Luís and Fortaleza stations, respectively. Similar results may be obtained in terms of F10.7 solar flux index (not shown here). Hence, the results of the occurrence frequency presented in the panels of Figure 7 are a consequence of the statistical trend of the data, and not directly related to some model deviation. The dataset shows that the distribution of the Vzp values over São Luís and Fortaleza is concentrated exactly in the same region where the SF1999 model also concentrates large percentage error. Due to this is reasonable to assume that the model is underestimating at any level of Vzp values, however, most of the occurrences are related to values around 40 m/s (25 m/s) for São Luís (Fortaleza).
These results are closely related to the arguments presented in Abdu et al. (2006, 2010) concerning the role of meridional winds in the nighttime low-latitude ionospheric electrodynamics. Abdu et al. (2010) demonstrated that during low solar flux conditions (e.g. F10.7 < 100 s.f.u.), the meridional winds close to the time of the pre-reversal enhancement are mostly equatorward over the Brazilian region (see Fig. 7 in their paper) either as found from Vzp values calculated from ionosonde data, or from the Horizontal Wind Model (HWM93) (Heelis et al., 1996). Hence, this equatorward component of the neutral wind, which presents distinct characteristics over the Brazilian region, may be the adequate candidate to explain the dissimilarities (i.e., the increasing values of (ζ) connected either with increasing values of Vzp or decreasing values of F10.7.
5 Conclusions
The vertical component of the ionospheric plasma drift plays a crucial role in the electrodynamical processes over the low-latitude region, being responsible for transporting and redistributing the plasma and accounting for instability processes. The instability processes which take place in the low-latitude nighttime ionosphere depend highly on the features of the vertical drift during the evening hours, i.e., the pre-reversal vertical drift, being its maximum value, Vzp, an excellent parameter to measure this contribution (e.g., Abdu et al., 2006 and references therein). Thus, any approach towards the prediction of instabilities such as the plasma bubbles and scintillation occurrence must rely upon accurate knowledge about the vertical drift and Vzp values. Along the years, data from different locations and several models have been analyzed in the attempt of a better understanding and a reliable prognosis of the behavior of Vzp over the Brazilian region. The most widely used model for the evaluation of the pre-reversal vertical drift is the Scherliess and Fejer empirical model (Scherliess & Fejer, 1999) which is based on Jicarmarca radar and AE satellite data. Notwithstanding, the Brazilian region differs considerably from Peruvian region in terms of the geomagnetic field topology, and hence, an asymmetric behavior is, to some extent, expected.
Some additional complexities for the pre-reversal vertical drift modeling over the Brazilian region (besides the geomagnetic declination already discussed) include its asymmetric magnitudes within the same magnetic meridian, that is, between conjugate points (e.g. Fig. 2 or Abdu et al., 2009) and the deviation between the theoretical and the data-based calculations (e.g. Fig. 3). Based on the measurements over the Brazilian region and its peculiar aspects, an investigation on the differences in Vzp values between the SF1999 model and those calculated from the data was performed. First, an initial analysis, using COPEX data obtained at the equatorial station of Cachimbo and the SF1999 representation for the same days (under the same day-by-day solar and geomagnetic conditions) was performed, which showed that the model underestimated the Vzp values in ~95% of the days (Fig. 4). Once this initial dataset was composed of only 66 days of data exclusively under high solar flux conditions, a broader dataset covering low to high solar cycle conditions (2001–2009) over two different stations under quiet geomagnetic conditions was employed. The equatorial station (for the period under analysis) of São Luís and the low-latitude station of Fortaleza were chosen due the data availability and geomagnetic positions. A total number of 1061 days (including both stations) was evaluated to verify the performance of SF1999 as compared to real data over the Brazilian region in an attempt to improve its representation. Major results emerging from this analysis may be summarized as follows:
The SF1999 empirical model underestimates the Vzp values in ~98% (i.e., 450 days) of the cases for São Luís station and ~92% (i.e., 554 days) for Fortaleza station, indicating a predominant underestimation trend by the model (e.g., Figs. 5 and 6).
The underestimation seems to be independent of seasonal influences suggesting that some additional factor may be present, besides that of the geomagnetic declination control (e.g., Fig. 5).
The difference ∆Vzp over both stations usually lays in the range of 0–40 m/s, hence, model results may present a considerable deviation from the observed values (e.g. Fig. 6).
A bivariate statistical distribution analysis reveals that the percentage error (ζ) between the SF1999 and the ionosonde calculated Vzp is enhanced (reduced) as the ionosonde calculated Vzp values increases (decreases) and with the F10.7 values decreasing (increasing) (e.g. Fig. 7).
The concentration of ζ occurrence seems to be a consequence of the statistical distribution of the parameters and not the result of a physical process (e.g., Fig. 8).
Based on the trend in ζ tendencies, the meridional winds are the most adequate candidate to explain the model deviations, once its orientation is predominantly equatorward during low solar flux conditions in the period of the pre-reversal vertical drift causing an increase of the Vzp values. These results are in good agreement with those presented in Abdu et al. (2006, 2010), however using a considerably wider dataset.
Acknowledgments
J. Sousasantos acknowledges FAPESP fellowship under process 2018/06158-9 (SPORT – Scintillation Prediction Observations Research Task), and also Dr. Joseph D. Huba and NRL for SAMI2 distribution. M.A. Abdu acknowledges the support received from the São Paulo State Foundation for Promotion of Research (FAPESP) through the process 2016/24970-7, also the support received form the Ministry of Science and Technology and Conselho Nacional de Desenvolvimento Científico e Tecnológico (CNPq) through the process: CNPq 300883/2008-0 and the Coordenação de Aperfeiçoamento de Pessoal de Nível Superior (Capes) for a senior visiting professorship at ITA/DCTA. A.M.S. acknowledges the Fundação de Amparo à Pesquisa do Estado de São Paulo (FAPESP) for the financial support under grant 2015/25357-4. I. S. Batista thanks CNPq (405555/2018-0 and 306844/2019-2). A.L.A. Silva acknowledges CNPq (141442/2020-4 and 132896/2018-4) for the financial support, and L.E.V. Loures da Costa acknowledges CNPq (313660/2019-0). This work uses the SAMI2 ionosphere model written and developed by the Naval Research Laboratory. The editor thanks Babatunde Olufemi Adebesin and an anonymous reviewer for their assistance in evaluating this paper.
References
- Abdu MA, Bittencourt JA, Batista IS. 1981. Magnetic declination control of the equatorial F region dynamo electric field development and spread F. J Geophys Res 86(A13): 11443–11446. https://doi.org/10.1029/JA086iA13p11443. [CrossRef] [Google Scholar]
- Abdu MA, Batista IS, Sobral JHA. 1992. A new aspect of magnetic declination control of equatorial spread F and F region dynamo. J Geophys Res 97(A10): 14897–14904. https://doi.org/10.1029/92JA00826. [CrossRef] [Google Scholar]
- Abdu MA, Iyer KN, de Medeiros RT, Batista IS, Sobral JHA. 2006. Thermospheric meridional wind control of the equatorial spread F and evening prereversal electric field. Geophys Res Lett 33(L07106): 1–4. https://doi.org/10.1029/2005GL024835. [Google Scholar]
- Abdu MA, Batista IS, Reinisch BW, de Sousa JR, Sobral JHA, Pedersen TR, Medeiros AF, Schuch NJ, de Paula ER, Grooves KM. 2009. Conjugate Point Equatorial Experiment (COPEX) campaign in Brazil: Electrodynamics highlights on spread F development conditions and day-to-day-variability. J Geophys Res 114(A04308): 1–21. https://doi.org/10.1029/2008/JA013749. [Google Scholar]
- Abdu MA, Batista IS, Brum CGM, MacDougall JW, Santos AM, de Souza JR, Sobral JHA. 2010. Solar flux effects on the equatorial evening vertical drift and meridional winds over Brazil: A comparison between observational data and the IRI model and the HWM representations. Adv Space Res 46: 1078–1085. https://doi.org/10.1016/j.asr.2010.06.009. [CrossRef] [Google Scholar]
- Alken P. 2009. A quiet time empirical model of equatorial vertical plasma drift in the Peruvian sector based on 150 km echoes. J Geophys Res 114(A02308): 1–6. https://doi.org/10.1029/2008JA013751. [CrossRef] [Google Scholar]
- Anderson ON, Rusch DW. 1980. Composition of the nighttime ionospheric F1 region near the magnetic equator. J Geophys Res 85(A2): 569–574. https://doi.org/10.1029/JA085iA02p00569. [CrossRef] [Google Scholar]
- Bailey GJ, Balan N, Su YZ. 1997. The Sheffield University plasmasphere model – a review. J Atmos Sol Terr Phys 59(13): 1541–1552. https://doi.org/10.1016/S1364-6826(96)00155-1. [CrossRef] [Google Scholar]
- Batista IS, Abdu MA, Bittencourt JA. 1986. Equatorial F region vertical plasma drifts: seasonal and longitudinal asymmetries in the American sector. J Geophys Res 91(A11): 12055–12064. https://doi.org/10.1029/JA091iA11p12055. [CrossRef] [Google Scholar]
- Batista IS, de Medeiros RT, Abdu MA, de Souza JR, Bailey GJ, de Paula ER. 1996. Equatorial ionospheric vertical plasma drift model over the Brazilian region. J Geophys Res 101(A5): 10887–10892. https://doi.org/10.1029/95JA03833. [CrossRef] [Google Scholar]
- Bravo MA, Batista IS, de Souza JR, Foppiano AJ. 2017. Equatorial ionospheric response to different estimated disturbed electric fields as investigated using Sheffield University Plasmasphere Ionosphere Model at INPE. J Geophys Res 122(10): 10511–10527. https://doi.org/10.1002/2017JA024265. [CrossRef] [Google Scholar]
- Bravo MA, Batista IS, de Souza JR, Foppiano AJ. 2019. Ionospheric response to disturbed winds during the 29 October 2003 geomagnetic storm in the Brazilian sector. J Geophys Res 124(11): 9405–9419. https://doi.org/10.1029/2019JA027187. [CrossRef] [Google Scholar]
- Fejer BG, de Paula ER, González SA, Woodman RF. 1991. Average vertical and zonal F region plasma drifts over Jicamarca. J Geophys Res 96(A8): 13901–13906. https://doi.org/10.1029/91JA01171. [CrossRef] [Google Scholar]
- Fejer BG, de Paula ER, Heelis RA, Hanson WB. 1995. Global equatorial ionospheric vertical plasma drifts measured by the AE-E satellite. J Geophys Res 100(A4): 5769–5776. https://doi.org/10.1029/94JA03240. [CrossRef] [Google Scholar]
- Fejer BG, Jensen JW, Su S-Y. 2008. Quiet time equatorial F region vertical plasma drift model derived from ROCSAT-1 observations. J Geophys Res 113(A05304): 1–10. https://doi.org/10.1029/2007JA012801. [CrossRef] [Google Scholar]
- Fejer BG, Hui D, Chau JL, Kudeki E. 2014. Altitudinal dependence of evening equatorial F region vertical plasma drifts. J Geophys Res 119: 5877–5890. https://doi.org/10.1002/2014/JA019949. [CrossRef] [Google Scholar]
- Fesen CG, Crowley G, Roble RG, Richmond AD, Fejer BG. 2000. Simulation of the pre-reversal enhancement in the low latitude vertical ion drifts. Geophys Res Lett 27(13): 1851–1854. https://doi.org/10.1029/2000GL000061. [CrossRef] [Google Scholar]
- Hedin AE, Biondi MA, Burnside RG, Hernadez G, Johson RM, Killen TL, Mazaudier C, Meriwether JW, Salah JE, Sica RJ, Smith RW, Spencer NW, Wickwar VB, Virdi TS. 1991. Revised global model of thermosphere winds using a satellite and ground-based observations. J Geophys Res 96(A5): 7657–7688. https://doi.org/10.1029/91JA00251. [CrossRef] [Google Scholar]
- Heelis AE, Fleming EL, Manson AH, Schmidlin FJ, Avery SK, Clark RR, Franke SJ, Fraser GJ, Tsuda T, Vial F, Vincent RA. 1996. Empirical wind model for the upper, middle and lower atmosphere. J Atmos Sol Terr Phys 58: 1421–1447. https://doi.org/10.1016/0021-9169(95)00122-0. [CrossRef] [Google Scholar]
- Huba JD, Joyce G, Fedder JA. 2000. Sami2 is another model of the ionosphere (SAMI2): A new low-latitude ionosphere model. J Geophys Res 105(A10): 23035–23053. https://doi.org/10.1029/JA000035. [CrossRef] [Google Scholar]
- Kendall P. 1962. Geomagnetic control of diffusion in the F2-region of the ionosphere-I: The form of the diffusion operator. J Atmos Terr Phys 24: 805–811. https://doi.org/10.1016/0021-9169(62)90201-5. [CrossRef] [Google Scholar]
- Medeiros RT, Abdu MA, Batista IS. 1997. Thermospheric meridional wind at low latitude from measurements of F layer peak height. J Geophys Res 102(A7): 14531–14540. https://doi.org/10.1029/97JA00799. [CrossRef] [Google Scholar]
- Pingree JE, Fejer BG. 1987. On the height variation of the equatorial F region vertical plasma drifts. J Geophys Res 92(A5): 4763–4766. https://doi.org/10.1029/JA092iA05p04763. [CrossRef] [Google Scholar]
- Santos AM, Abdu MA, Sobral JHA, Mascarenhas M, Nogueira PAB. 2013. Equatorial evening prereversal vertical drift dependence on solar EUV flux and F10.7 index during quiet and disturbed periods. J Geophys Res 118(7): 4662–4671. https://doi.org/10.1002/jgra.50438. [CrossRef] [Google Scholar]
- Scherliess L, Fejer BG. 1999. Radar and satellite global equatorial F region vertical drift model. J Geophys Res 104(A4): 6829–6842. https://doi.org/10.1029/1999JA900025. [CrossRef] [Google Scholar]
- Souza JR, Abdu MA, Batista IS, Bailey GJ. 2000. Determination of vertical plasma drift and meridional wind using the Sheffield University Plasmasphere Ionosphere Model and ionospheric data at equatorial and low latitudes in Brazil: Summer solar minimum and maximum conditions. J Geophys Res 105(A6): 12813–12821. https://doi.org/10.1029/1999JA000348. [CrossRef] [Google Scholar]
- Thébault E, Finlay CC, Beggan CD, et al. 2015. International geomagnetic reference field: the 12th generation. Earth, Planets Space 67(79): 1–19. https://doi.org/10.1186/s40623-015-0228-9. [Google Scholar]
- Tsunoda R. 1985. Control of the seasonal and longitudinal occurrence of equatorial scintillations by the longitudinal gradient in the integrated E region Pedersen conductivity. J Geophys Res 90(A1): 447–456. https://doi.org/10.1029/JA090Ia01P00447. [CrossRef] [Google Scholar]
Cite this article as: Sousasantos J, Abdu MA, Santos A, Batista I, Silva A, et al. 2020. Further complexities on the pre-reversal vertical drift modeling over the Brazilian region: A comparison between long-term observations and model results. J. Space Weather Space Clim. 10, 20.
All Figures
|
Figure 1 Global profile of the declination (colors) along the geomagnetic equator (curve) showing the larger declination (red) over the Brazilian region. The dashed line delimitates the region between 90° W and 0° (i.e., 270°–0°). The green symbols indicate the location of some stations that are mentioned along the text. |
| In the text | |
|
Figure 2 Vertical drifts calculated through ionosonde data for the equatorial station, Cachimbo (left panel), and conjugate point stations at southern (middle panel) Campo Grande and northern hemisphere (right panel) Boa Vista. More details on this calculation are given in Abdu et al. (2009). |
| In the text | |
|
Figure 3 Comparison between the values of Vzp obtained over Campo Grande. Ionosonde measured values are presented in blue (CG-COPEX), and theoretical Vzp values are presented in red [CG-COPEX(δ)]. The theoretical Vzp values were obtained using the values from ionosonde data over Cachimbo equatorial station and the expression for δ. The gray dashed curve corresponds to the Vzp obtained from ionosonde over Cachimbo and is provided for reference. |
| In the text | |
|
Figure 4 ∆Vzp (COPEX-SF1999) over Cachimbo. The colored circles represent, from blue to red, increasing values of ∆Vzp. The red dashed line corresponds to ∆Vzp = 0, and the black solid line indicates the trend of increase in the errors with seasonal transition (equinox-summer solstice). |
| In the text | |
|
Figure 5 Vzp values as calculated from ionosondes data (black lines) and obtained from SF1999 model (red lines) for São Luís (a) and Fortaleza (b) stations. The data comprises from maximum to minimum of the solar cycle 23. |
| In the text | |
|
Figure 6 ∆Vzp calculated for the equatorial São Luís (a) and the low-latitude Fortaleza (b) stations. The colored circles indicate, from blue to red, increasing values of ∆Vzp. In both stations SF1999 underestimated the values for the large majority of the days (i.e., ∆Vzp > 0). |
| In the text | |
|
Figure 7 Bivariate distribution of ζ for the Vzp values obtained from ionosonde data for São Luís and for the F10.7 index (panels a and b) and similar results for Fortaleza (panels c and d) stations, respectively. |
| In the text | |
|
Figure 8 Statistical distribution of Vzp obtained through sounding data over São Luís (panel a) and Fortaleza (panel b) stations. |
| In the text | |
Current usage metrics show cumulative count of Article Views (full-text article views including HTML views, PDF and ePub downloads, according to the available data) and Abstracts Views on Vision4Press platform.
Data correspond to usage on the plateform after 2015. The current usage metrics is available 48-96 hours after online publication and is updated daily on week days.
Initial download of the metrics may take a while.