Open Access
Fig. 13
Download original image
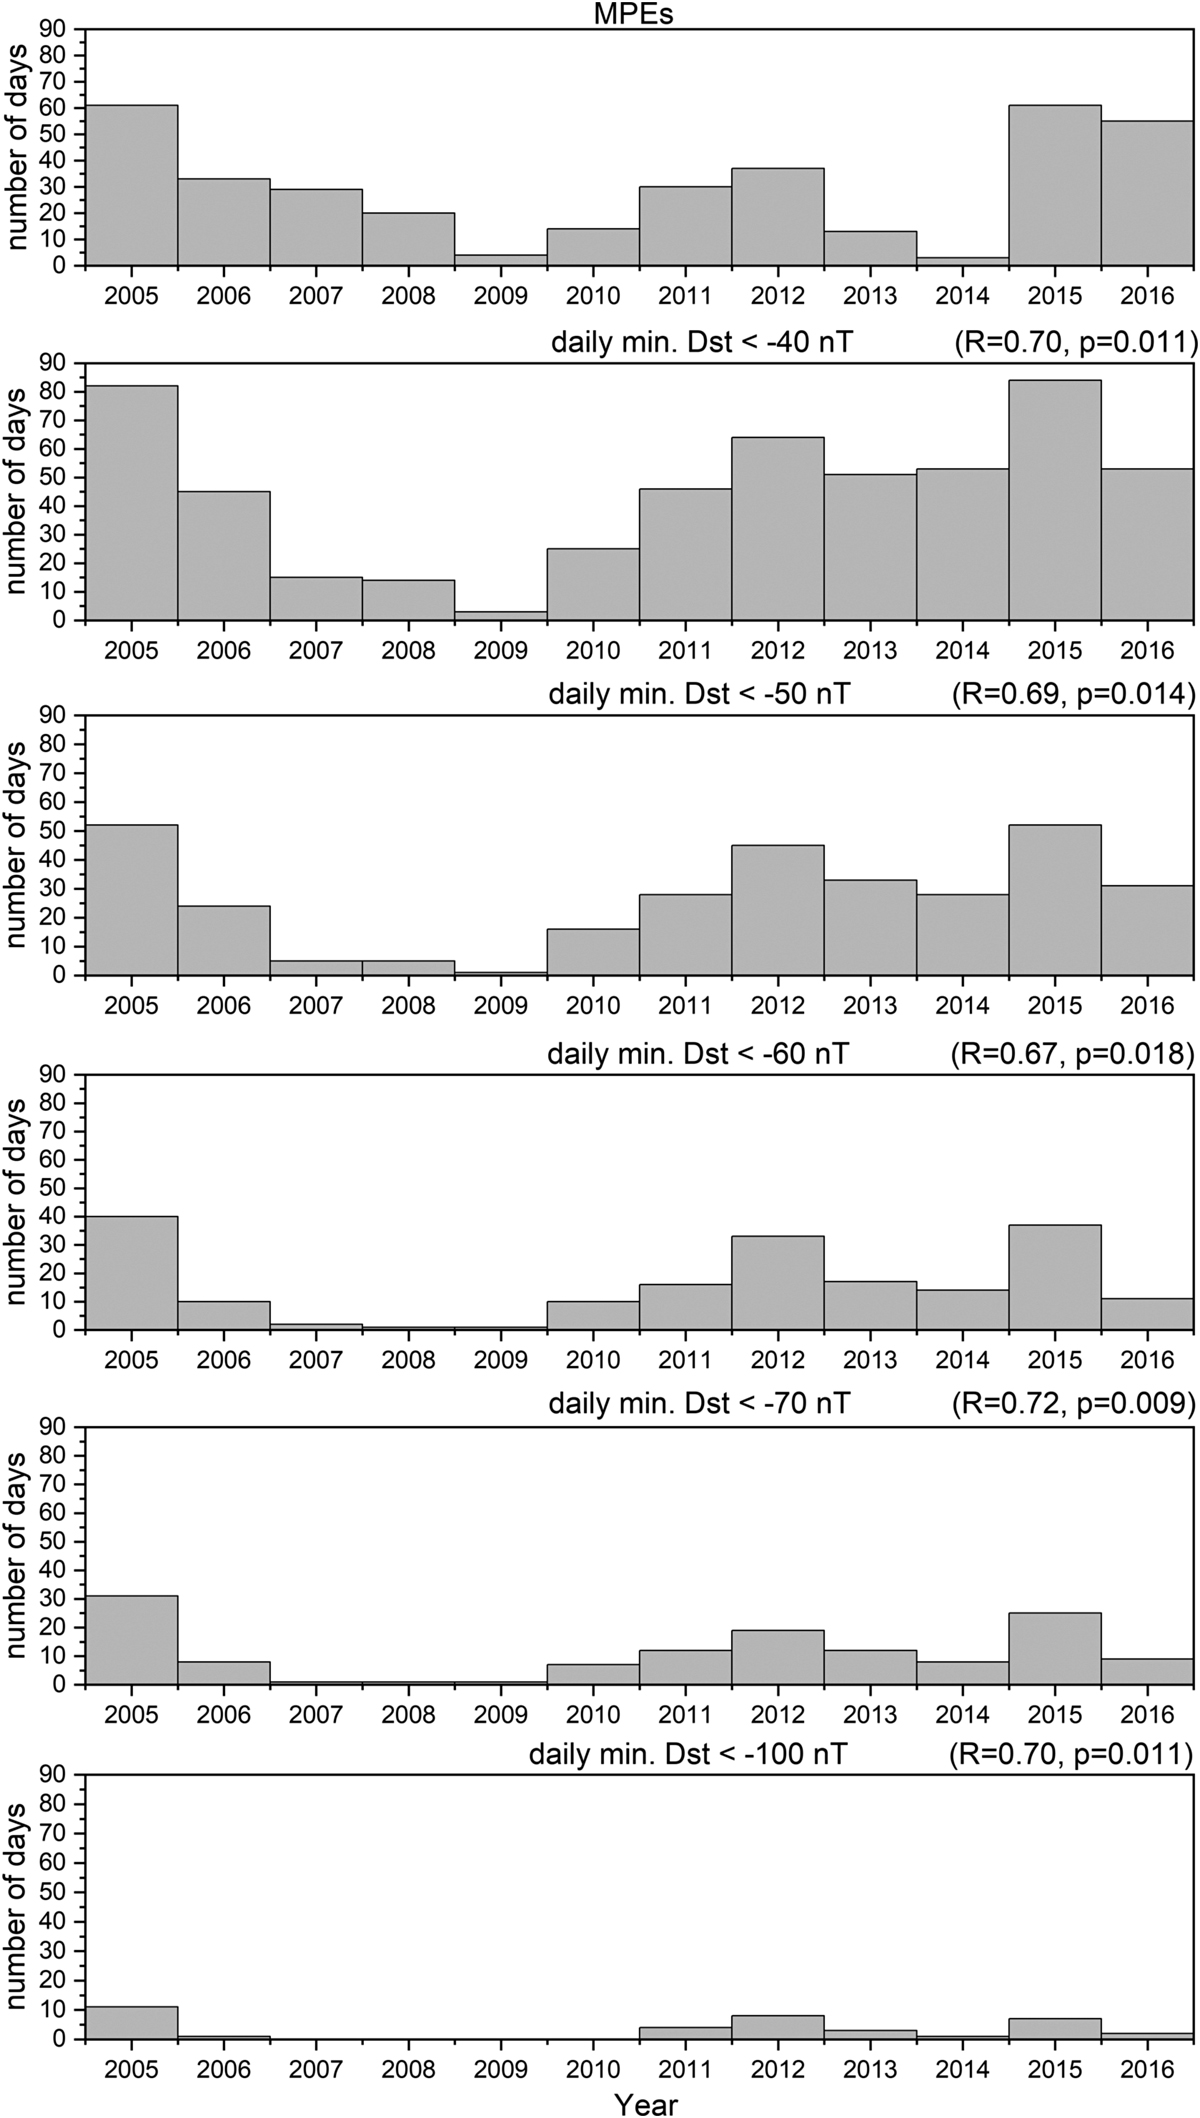
Figure, from top to bottom, shows yearly distributions of numbers of days with MPEs, Dstmin < −40 nT, Dstmin < −50 nT, Dstmin < −60 nT, Dstmin < −70 nT, and Dstmin < −100 nT, respectively. At the top of the panels, the correlation coefficients between the respective MPEs and Dst distributions are presented.
Current usage metrics show cumulative count of Article Views (full-text article views including HTML views, PDF and ePub downloads, according to the available data) and Abstracts Views on Vision4Press platform.
Data correspond to usage on the plateform after 2015. The current usage metrics is available 48-96 hours after online publication and is updated daily on week days.
Initial download of the metrics may take a while.