Fig. 9
Download original image
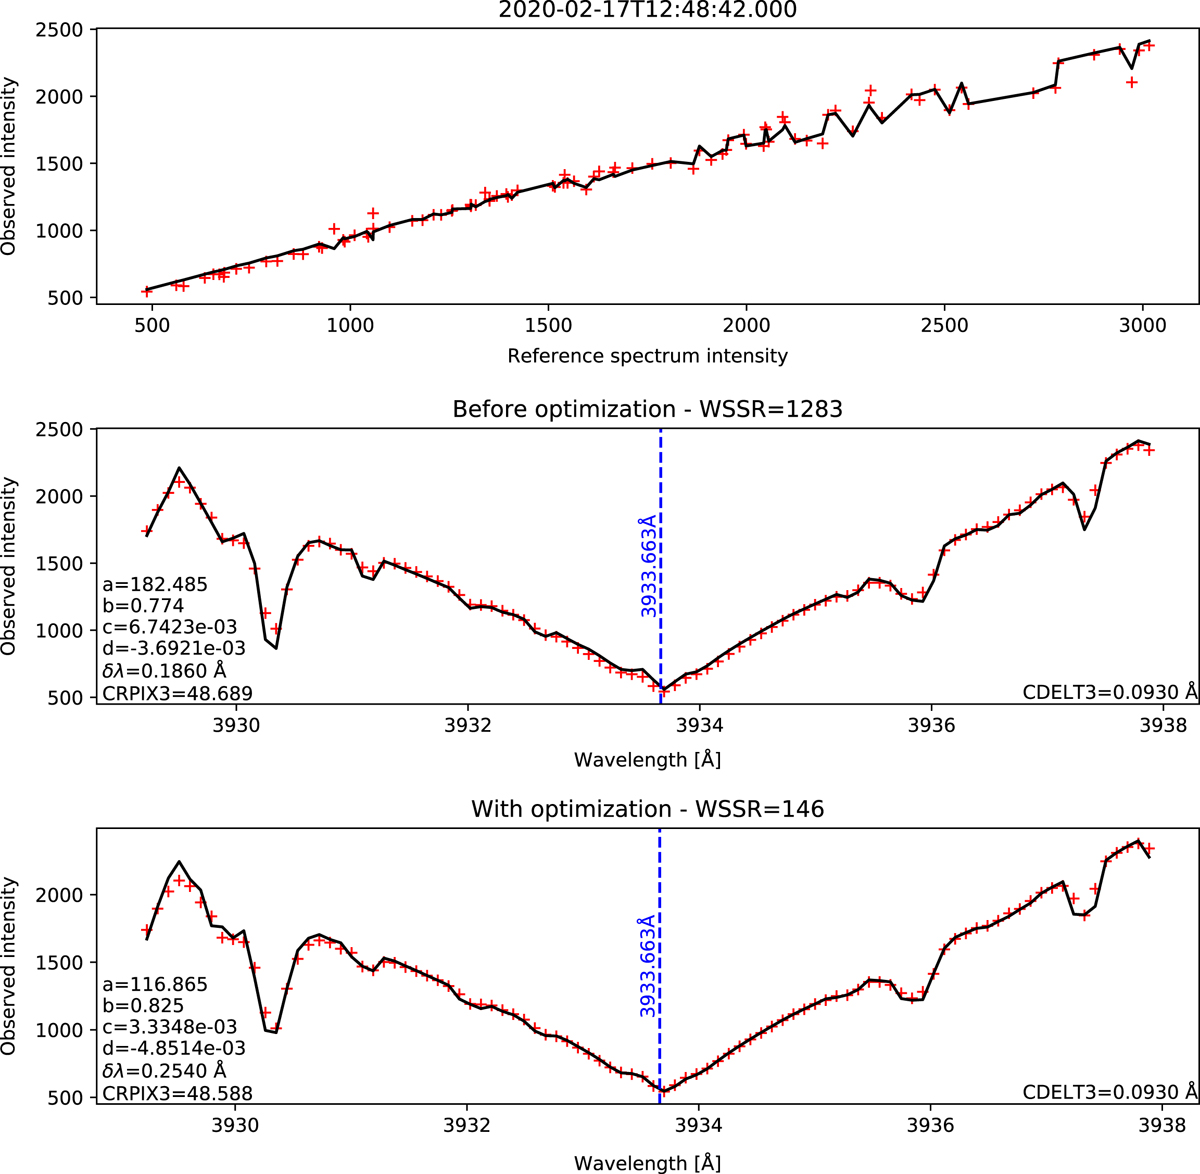
Example of wavelength calibration of CaII K spectral line. The red crosses represent the observed disk-integrated intensities S
obs (Eq. (1)). The black lines are the scaled smoothed reference spectrum ![]() (Eq. (5)). Top panel: S
obs and
(Eq. (5)). Top panel: S
obs and ![]() are plotted as a function of the intensities of the smoothed reference spectrum
are plotted as a function of the intensities of the smoothed reference spectrum ![]() (Eq. (3)). Middle and bottom panels: S
obs and
(Eq. (3)). Middle and bottom panels: S
obs and ![]() are plotted as a function of wavelength. The coefficients a, b, c and d of the fit are shown. The vertical blue line gives the line core position at λ
c
= 3933.663 Å. The corresponding FITS index is given by CRPIX3. The interval over which the reference spectra is smoothed is given by δλ. WSSR is the resulting weighted sum of squared residuals. The top and middle panels give the fit with the initial parameters and the bottom panel gives the fit and parameters after optimization (lower WSSR).
are plotted as a function of wavelength. The coefficients a, b, c and d of the fit are shown. The vertical blue line gives the line core position at λ
c
= 3933.663 Å. The corresponding FITS index is given by CRPIX3. The interval over which the reference spectra is smoothed is given by δλ. WSSR is the resulting weighted sum of squared residuals. The top and middle panels give the fit with the initial parameters and the bottom panel gives the fit and parameters after optimization (lower WSSR).
Current usage metrics show cumulative count of Article Views (full-text article views including HTML views, PDF and ePub downloads, according to the available data) and Abstracts Views on Vision4Press platform.
Data correspond to usage on the plateform after 2015. The current usage metrics is available 48-96 hours after online publication and is updated daily on week days.
Initial download of the metrics may take a while.