Fig. 10
Download original image
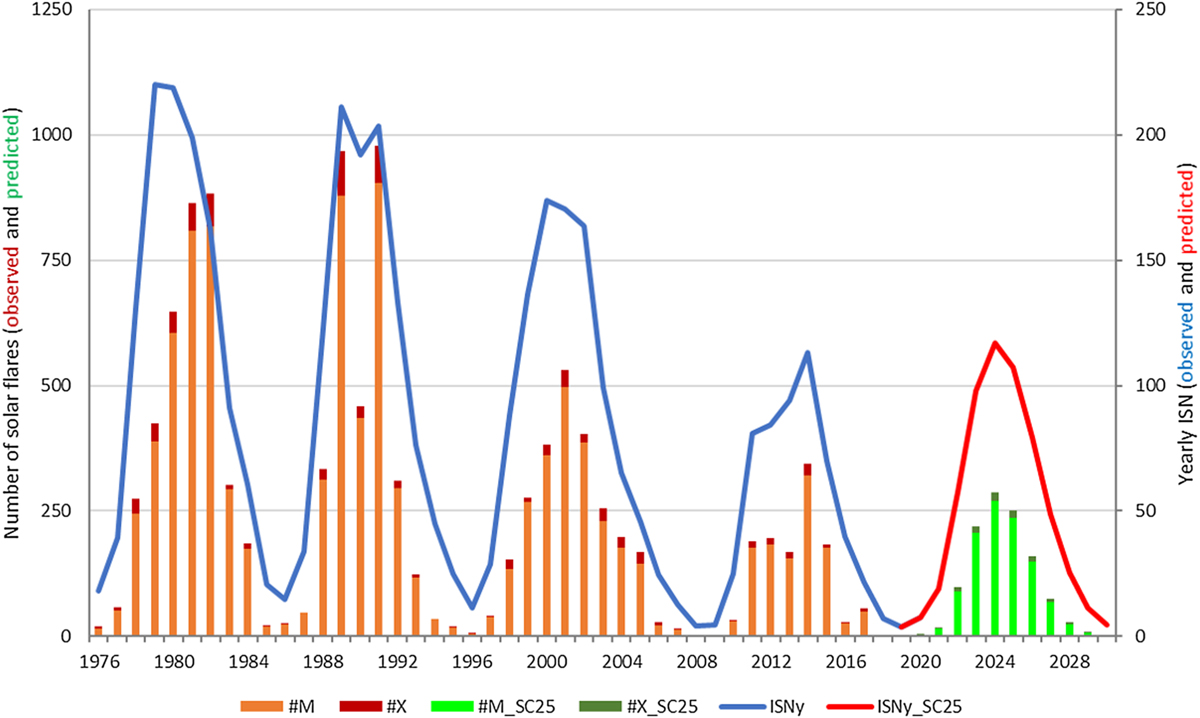
This graph shows the observed (SC21–24) and predicted (SC25) yearly ISN (ISNy), as well as the yearly number of observed and predicted M- and X-class flares. The SC25 flare numbers are expected to be similar to SC24, and 3–4 times smaller than SC21 and 22. For the expected maximum year for SC25 (2024), 270 (±70) M-class flares and 17 (±8) X-class flares can be expected. The flare numbers as well as their distribution over SC25 can be quite different from the ones here displayed, if e.g. the final sunspot numbers deviate significantly from the sunspot curve used here, and may be further skewed with the occurrence of SARs. Nonetheless, the total numbers are not expected to deviate significantly for the ones expected over the entire SC25, i.e. 1075 M- and 76 X-class flares.
Current usage metrics show cumulative count of Article Views (full-text article views including HTML views, PDF and ePub downloads, according to the available data) and Abstracts Views on Vision4Press platform.
Data correspond to usage on the plateform after 2015. The current usage metrics is available 48-96 hours after online publication and is updated daily on week days.
Initial download of the metrics may take a while.