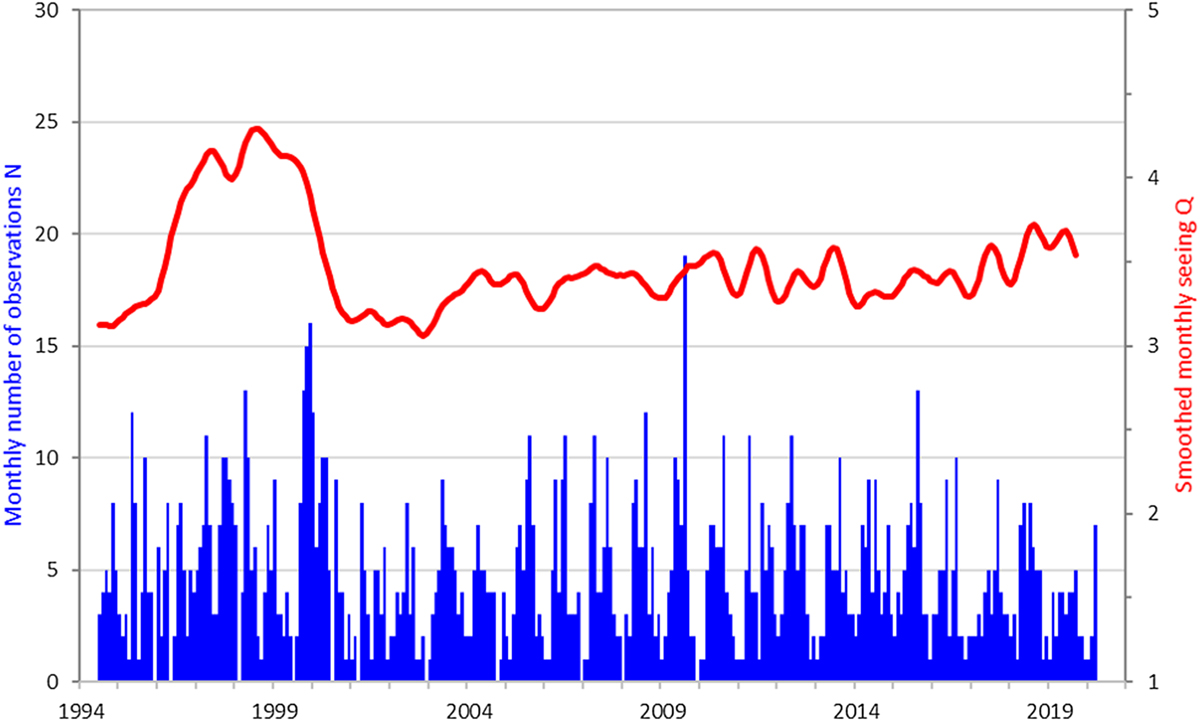
Fig. 2
Download original image
Evolution of the monthly number of PF observations and monthly smoothed seeing Q, after having removed the days with poor seeing conditions (Q < 3). The period with higher Q-values (1996–2000) corresponds with the period observed from San Antonio, Texas, USA. A small jump in Q can be seen from 2003 onwards, when it was decided to favour observations with better seeing conditions over larger number of observations.
Current usage metrics show cumulative count of Article Views (full-text article views including HTML views, PDF and ePub downloads, according to the available data) and Abstracts Views on Vision4Press platform.
Data correspond to usage on the plateform after 2015. The current usage metrics is available 48-96 hours after online publication and is updated daily on week days.
Initial download of the metrics may take a while.