Open Access
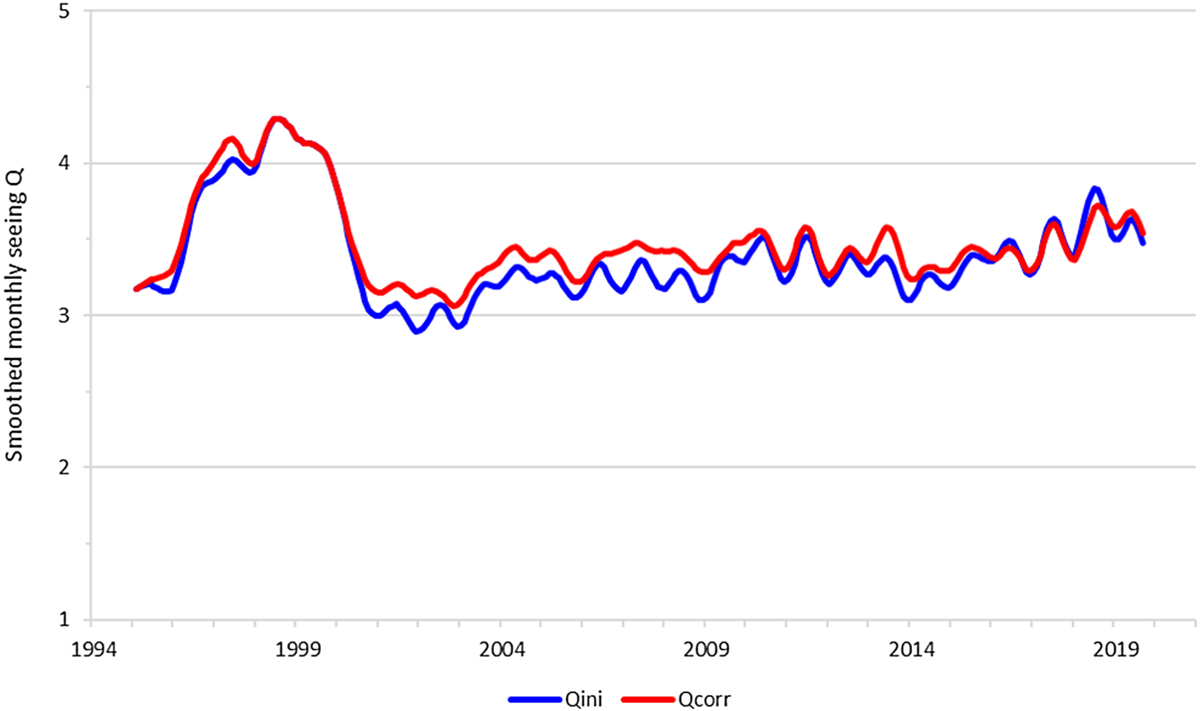
Fig. 4
Download original image
Evolution of the smoothed seeing Q over the period considered. The blue line (Qini) concerns the data prior to the correction for days with poor seeing, i.e. before removing the observations with Q < 3. The correction is mostly upwards (better seeing; Qcorr), and particularly noteworthy for the 2003–2009 timeframe.
Current usage metrics show cumulative count of Article Views (full-text article views including HTML views, PDF and ePub downloads, according to the available data) and Abstracts Views on Vision4Press platform.
Data correspond to usage on the plateform after 2015. The current usage metrics is available 48-96 hours after online publication and is updated daily on week days.
Initial download of the metrics may take a while.