Fig. 9
Download original image
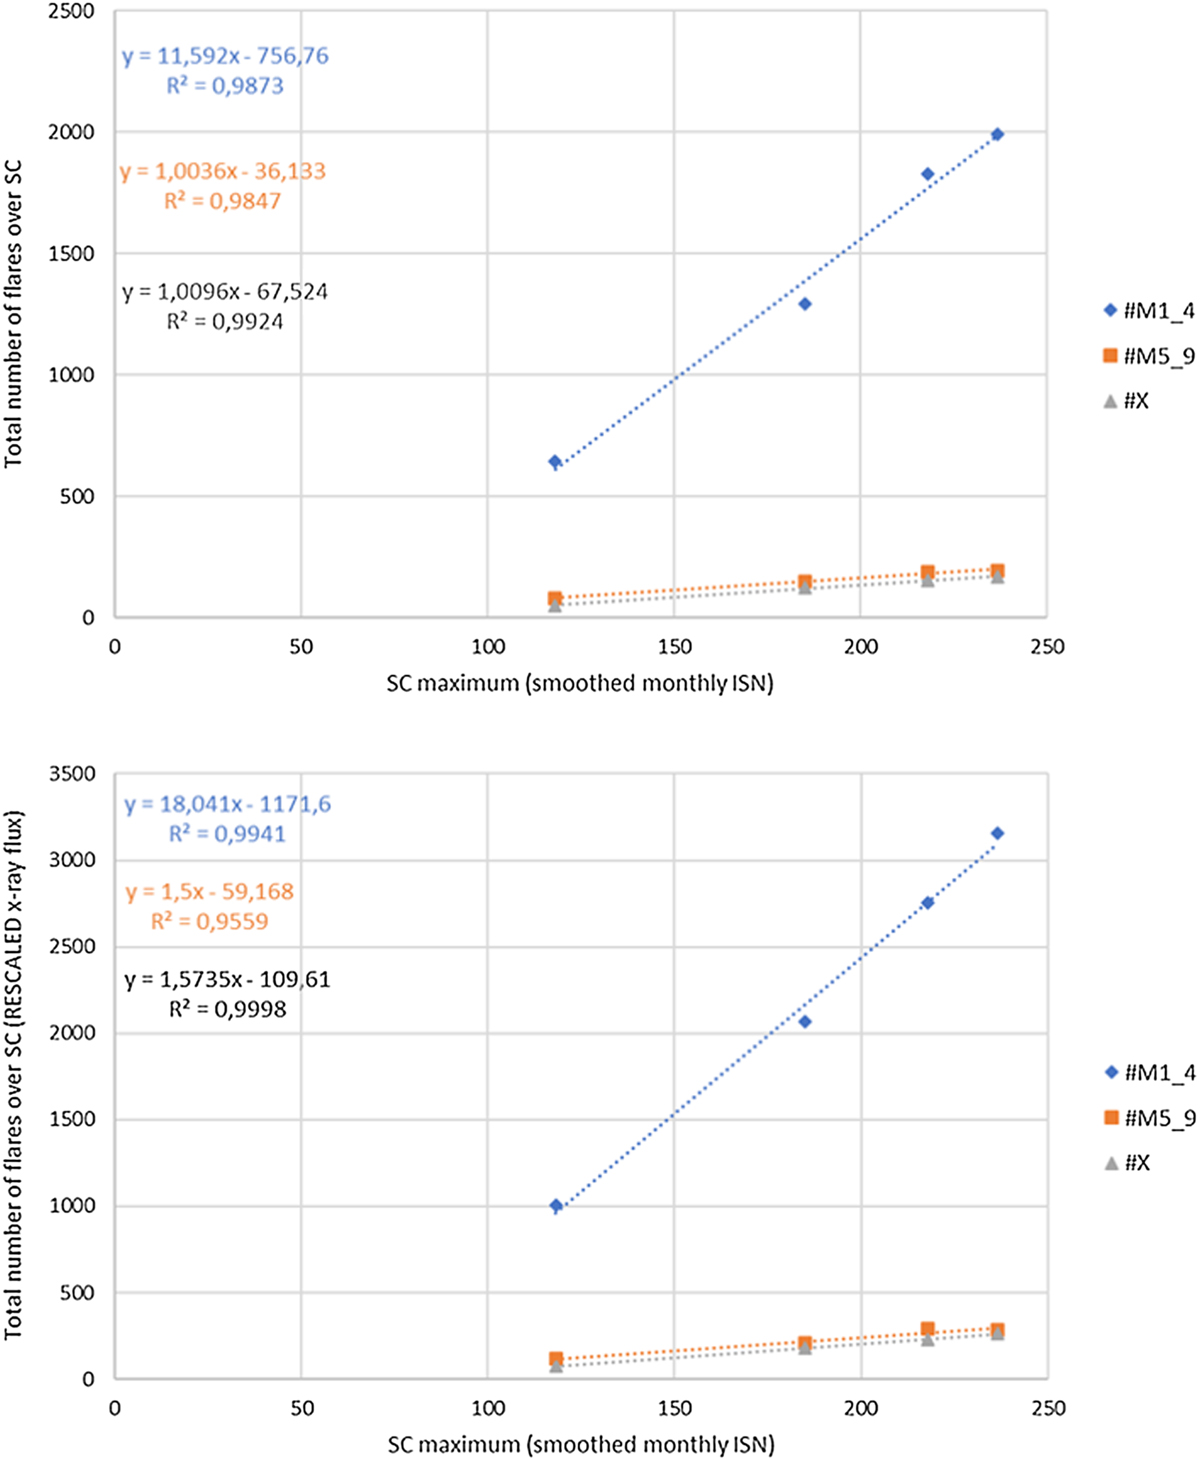
(Top) The total number of flares per solar cycle in each category, i.e. M1 to M4 (blue), M5 to M9 (orange), and X (grey), against the maximum smoothed monthly sunspot number of the respective cycle. The equations of the trendline and the square of the correlation coefficient (r2) for each flare category are in the upper left corner. (Bottom) The same as in the top figure, but this time without the rescaling factor of 0.7 applied over the solar cycles. There’s an increase of about 55% in the number of M-class flares, and 52% in the number of X-class flares. The correlations and p-values improve a bit for the M1_4 and X-class bin, but slightly decrease for the M5_9 bin (r and p from 0.9923 and 0.008 to 0.9777 and 0.022).
Current usage metrics show cumulative count of Article Views (full-text article views including HTML views, PDF and ePub downloads, according to the available data) and Abstracts Views on Vision4Press platform.
Data correspond to usage on the plateform after 2015. The current usage metrics is available 48-96 hours after online publication and is updated daily on week days.
Initial download of the metrics may take a while.