Open Access
Fig. 4
Download original image
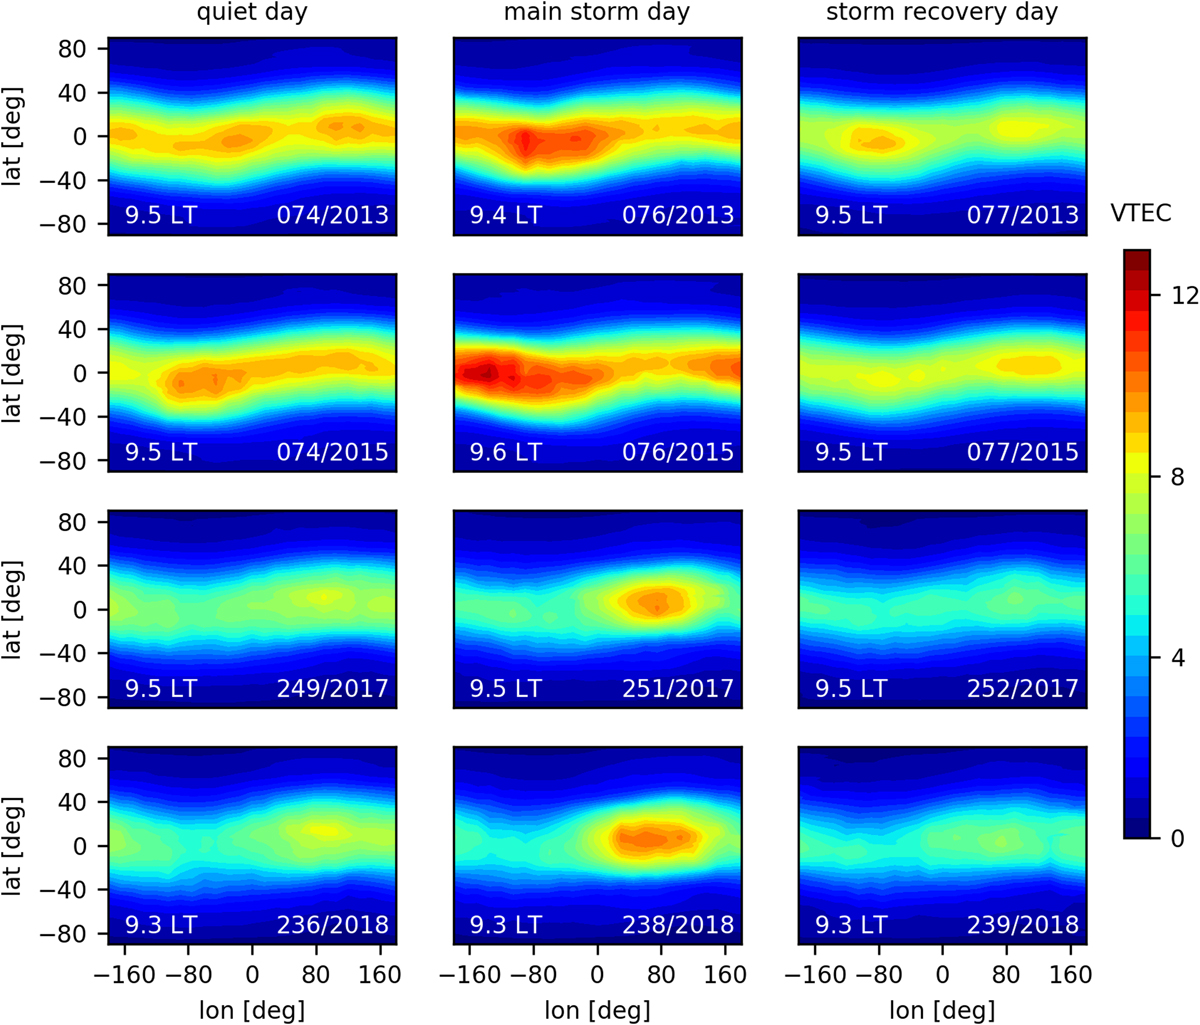
Daily VTEC maps above LEO orbit height during analyzed storm days obtained with tomographic reconstruction based on METOP TEC measurements during satellite rising. The unit of the color bar is TECU and the given LT hour is computed in the equatorial region.
Current usage metrics show cumulative count of Article Views (full-text article views including HTML views, PDF and ePub downloads, according to the available data) and Abstracts Views on Vision4Press platform.
Data correspond to usage on the plateform after 2015. The current usage metrics is available 48-96 hours after online publication and is updated daily on week days.
Initial download of the metrics may take a while.