Fig. 7
Download original image
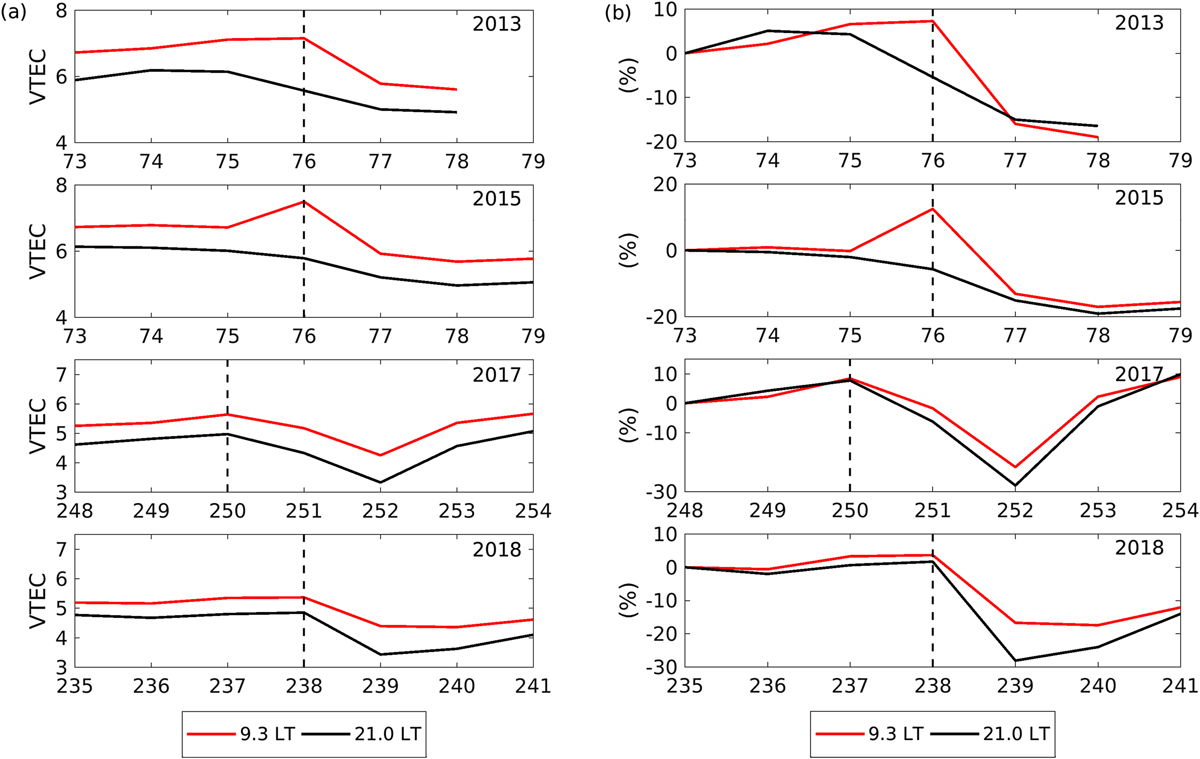
(a) Daily average of the VTEC derived from the tomography method at 9.3 and 21.0 LT. The average was computed based on data between 40° S and 40° N latitude. METOP data was missing to perform reconstructions at DOY 79/2013. (b) VTEC percentage relative to the first day of the time series, considered here as a quiet day (low Kp values). The dashed lines indicate the day of the storm onset. The VTEC unit is given in TECU.
Current usage metrics show cumulative count of Article Views (full-text article views including HTML views, PDF and ePub downloads, according to the available data) and Abstracts Views on Vision4Press platform.
Data correspond to usage on the plateform after 2015. The current usage metrics is available 48-96 hours after online publication and is updated daily on week days.
Initial download of the metrics may take a while.