Fig. 9
Download original image
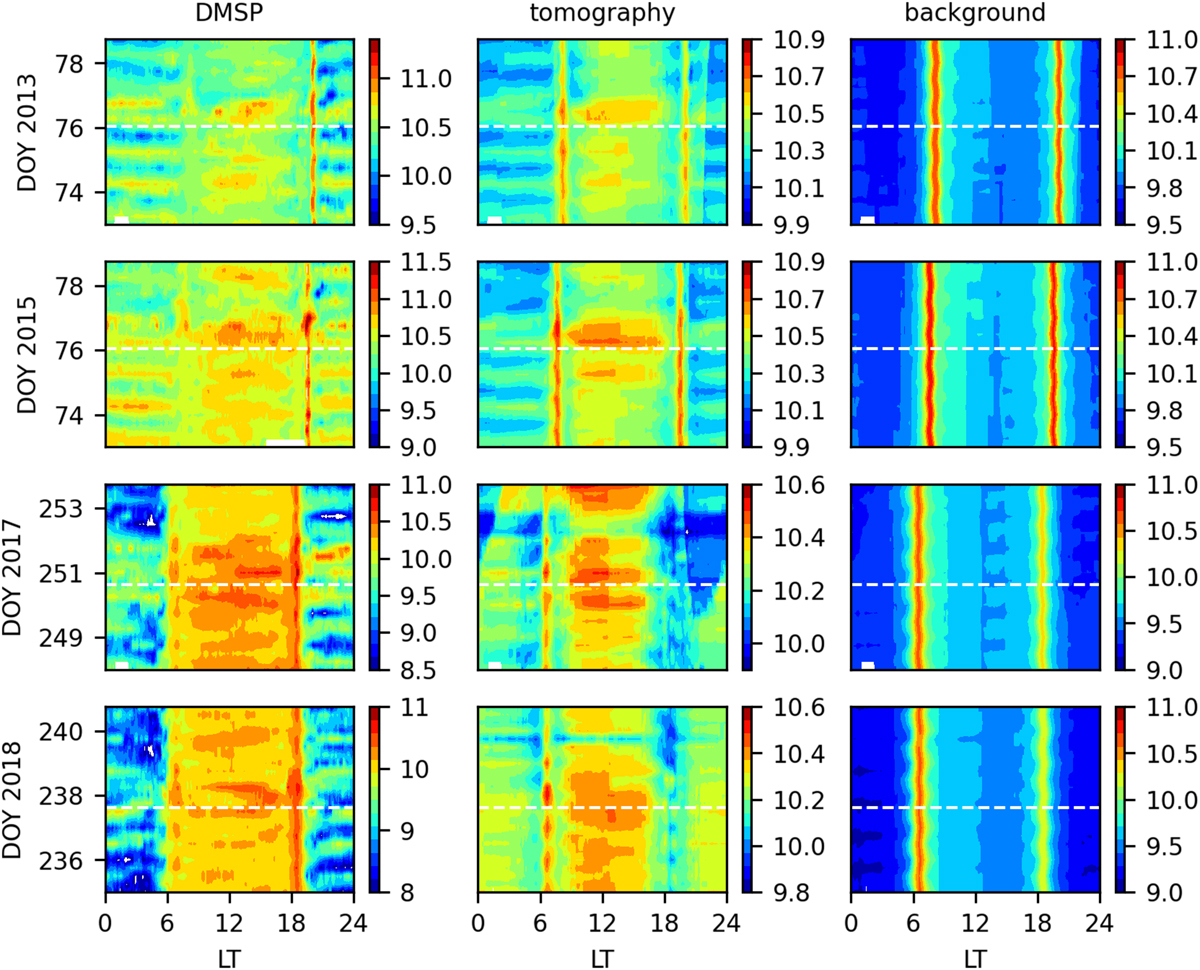
Electron density distributions of DMSP, tomography and background in terms of local time and days of year. White line indicates the beginning of the corresponding storm. DMSP-18 was selected for years 2013 and 2015 and DMSP-17 was selected for years 2017 and 2018. Color scale varies within each plot to adapt to a better visualization of the spatial distributions. Units of color bar are in log(Ne) with base 10.
Current usage metrics show cumulative count of Article Views (full-text article views including HTML views, PDF and ePub downloads, according to the available data) and Abstracts Views on Vision4Press platform.
Data correspond to usage on the plateform after 2015. The current usage metrics is available 48-96 hours after online publication and is updated daily on week days.
Initial download of the metrics may take a while.