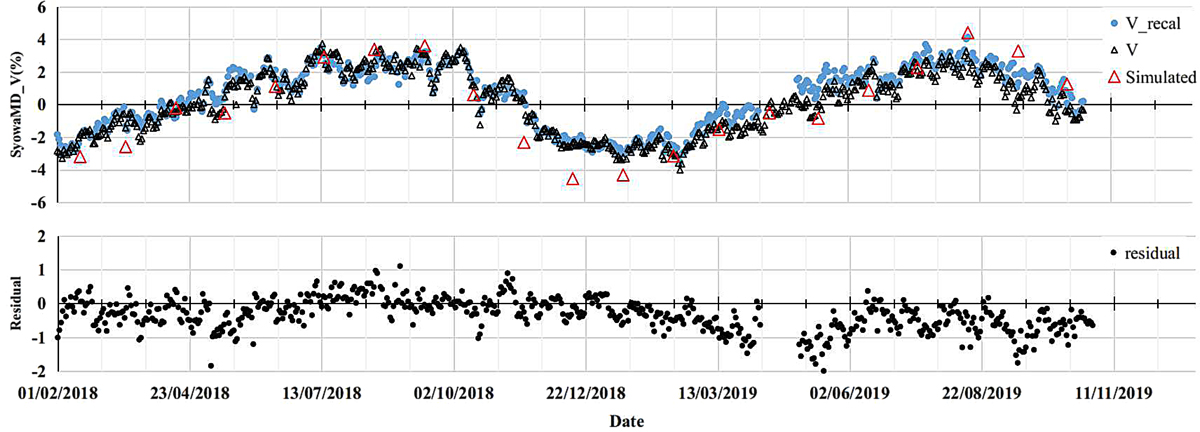
Fig. 10
Download original image
Top: The pressure corrected daily mean count rate in Syowa MD vertical channel (SYO_MD_V) (open black triangle) and the variation reproduced from αMSS and ΔTMSS (blue circle) (see text). Open red triangles indicate the CR variation reproduced by the MC simulation of particle transport in the atmosphere (see text). Bottom: The observed variation corrected for the atmospheric temperature effect. Minor tick marks on the horizontal axis are indicated every 27 days.
Current usage metrics show cumulative count of Article Views (full-text article views including HTML views, PDF and ePub downloads, according to the available data) and Abstracts Views on Vision4Press platform.
Data correspond to usage on the plateform after 2015. The current usage metrics is available 48-96 hours after online publication and is updated daily on week days.
Initial download of the metrics may take a while.