Fig. 13
Download original image
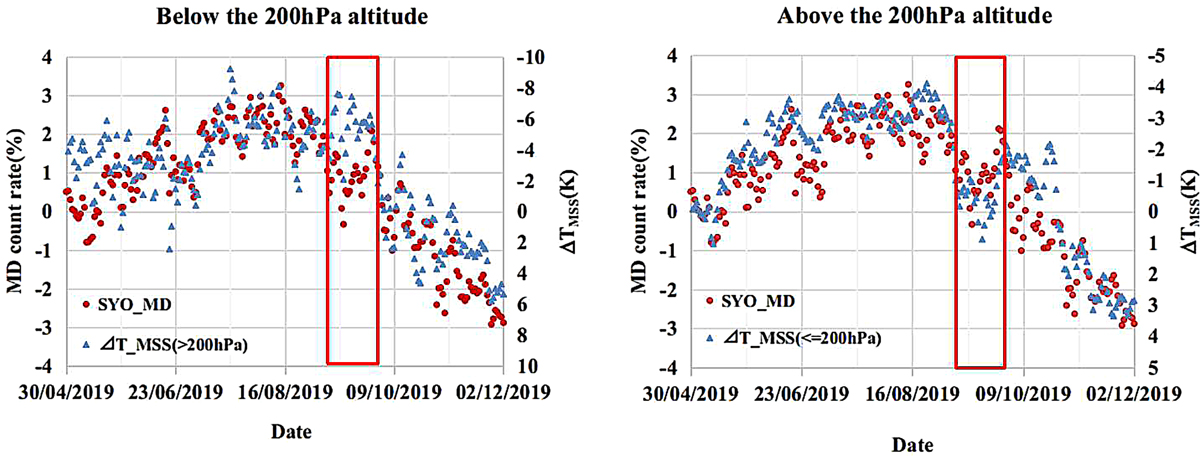
Pressure corrected daily mean SYO_MD_V count rate shown by red solid circles and the left vertical axis. ΔTMSS (calculated with Eq. (3)) is shown by blue solid circles on the right vertical axis using an inverted scale. The left panel is calculated from the temperature below the 200 hPa altitude and the right panel from the temperature above the 200 hPa altitude. The SSW event is indicated by a red rectangle in both panels. Minor tick marks on the horizontal axis are indicated every 27 days.
Current usage metrics show cumulative count of Article Views (full-text article views including HTML views, PDF and ePub downloads, according to the available data) and Abstracts Views on Vision4Press platform.
Data correspond to usage on the plateform after 2015. The current usage metrics is available 48-96 hours after online publication and is updated daily on week days.
Initial download of the metrics may take a while.