Fig. 14
Download original image
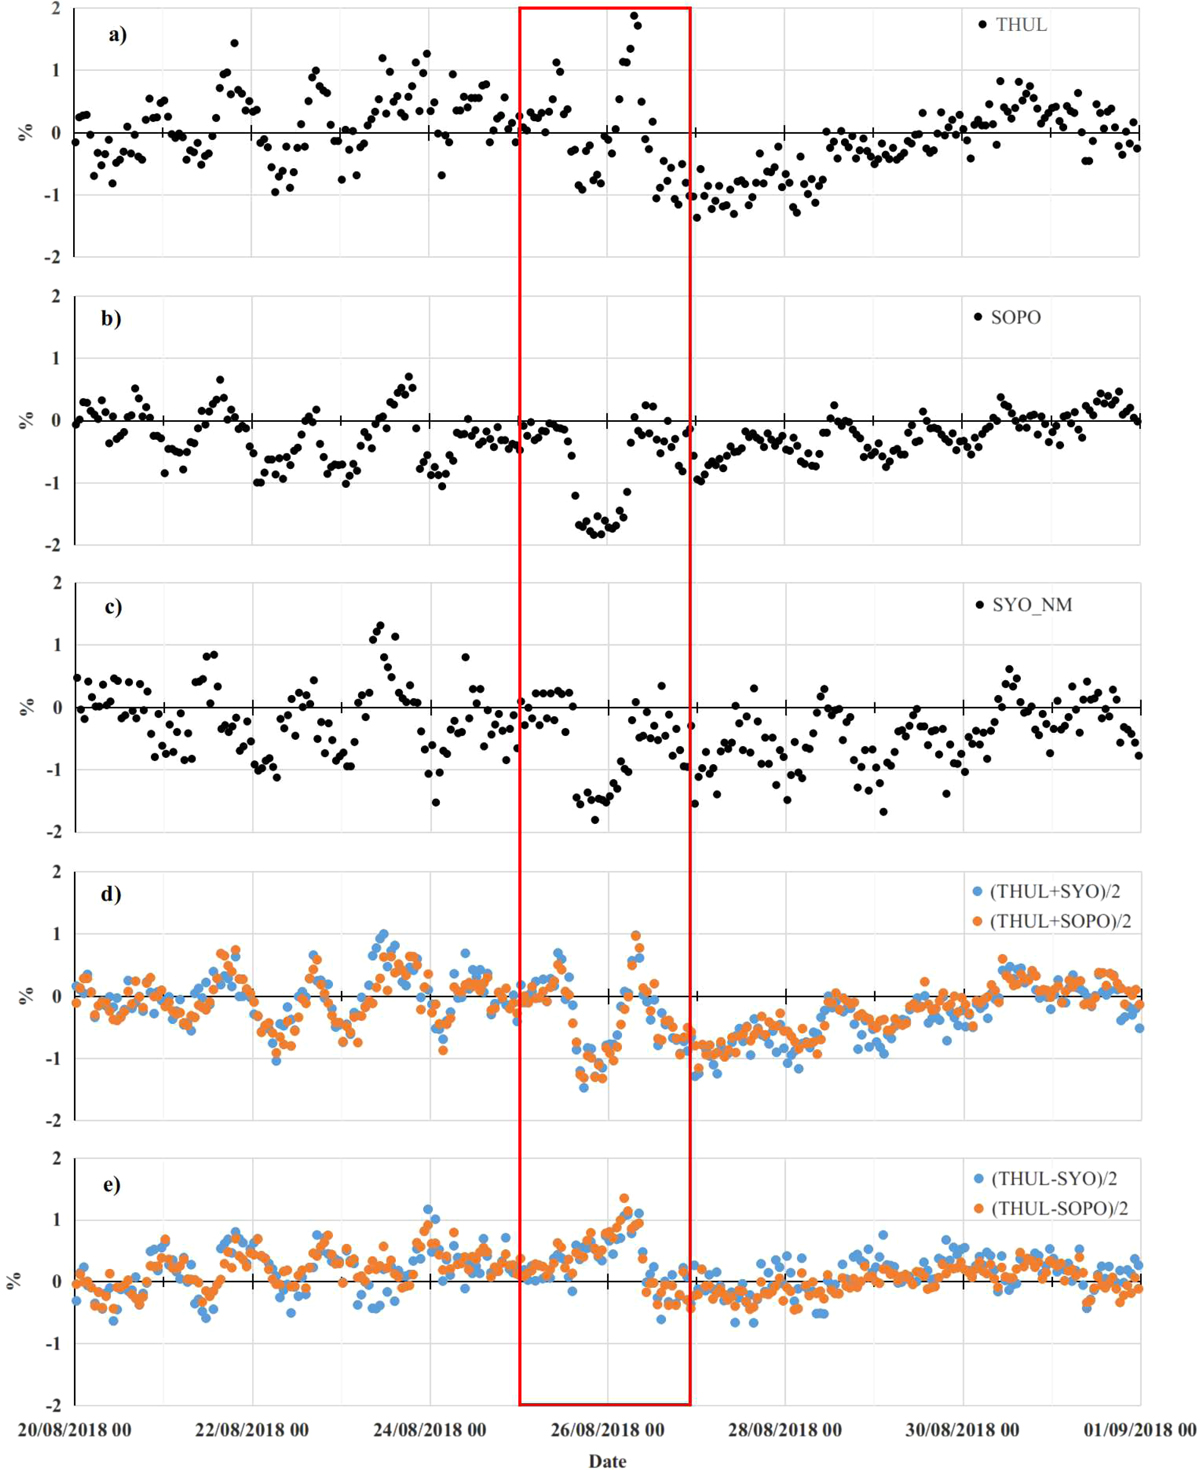
Hourly count rate variations observed by (a) Thule NM (THUL), (b) South Pole NM (SOPO), and (c) Syowa NM (SYO NM). NM at northern and southern high-latitudes show different variations. To see contributions from the GCR density and the north–south anisotropy separately, we plot the average and difference between NMs at northern and southern high-latitudes in panels (d) and (e). Orange and blue solid circles in panels (d) and (e) show the average and difference in THUL and SOPO pair and THUL and SYO NM pair, respectively. Tick marks on the horizontal axis are at one day intervals.
Current usage metrics show cumulative count of Article Views (full-text article views including HTML views, PDF and ePub downloads, according to the available data) and Abstracts Views on Vision4Press platform.
Data correspond to usage on the plateform after 2015. The current usage metrics is available 48-96 hours after online publication and is updated daily on week days.
Initial download of the metrics may take a while.