Fig. 7
Download original image
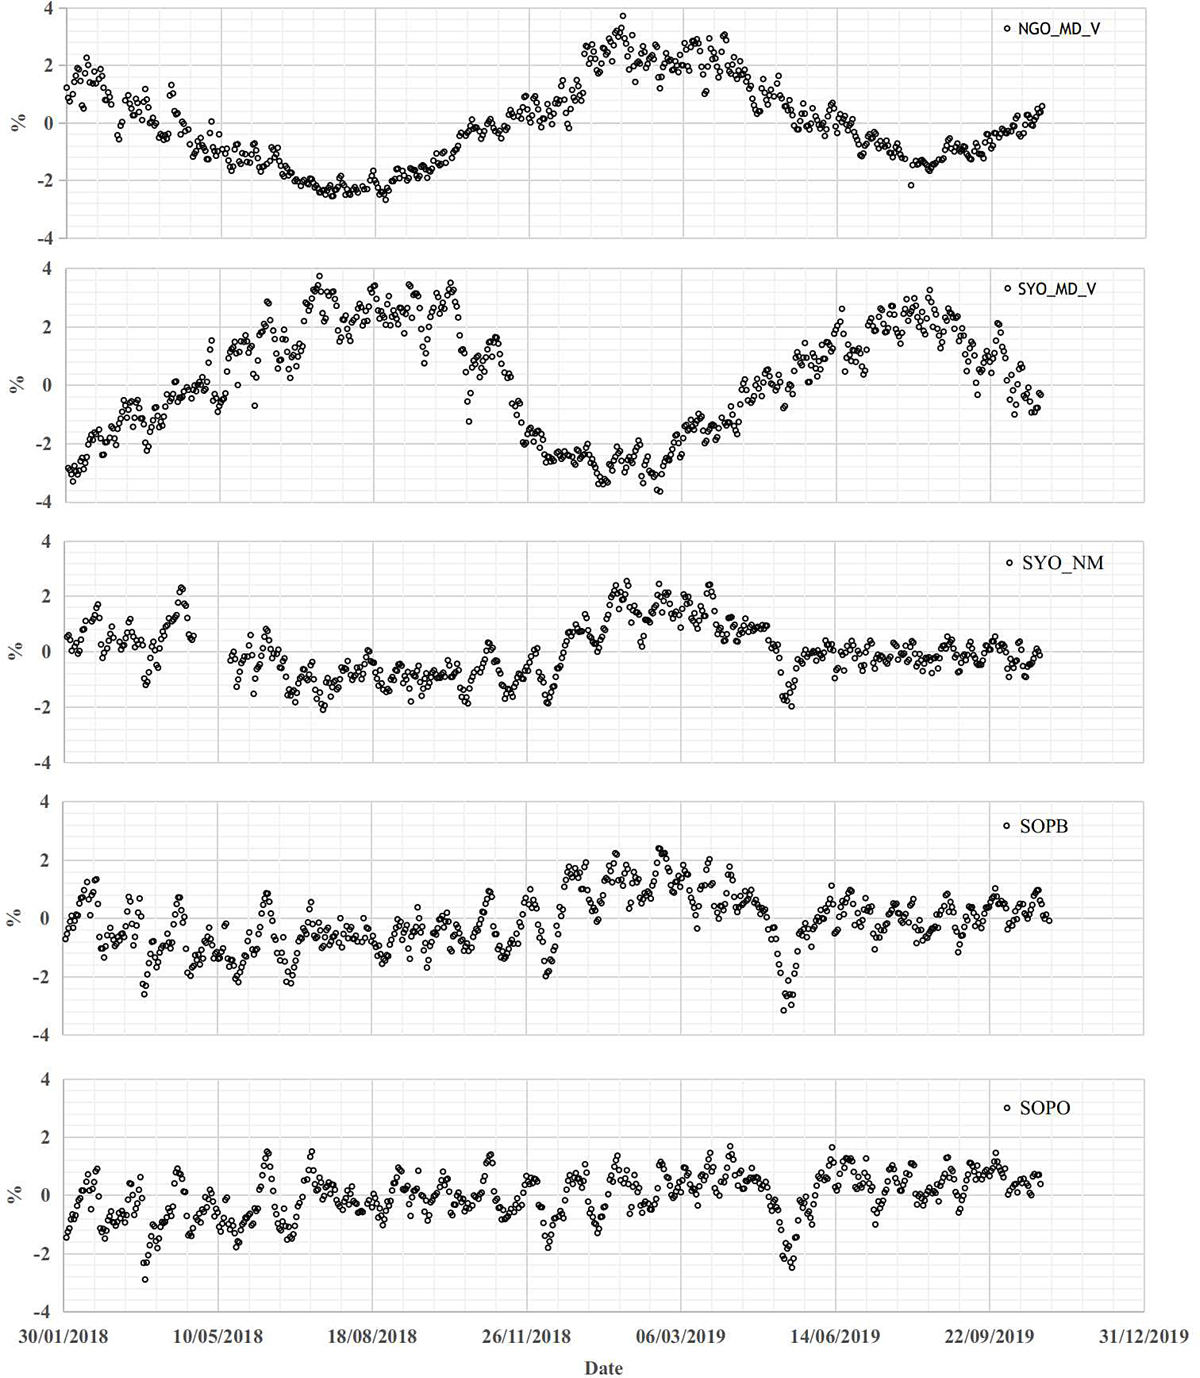
Temporal variations of the pressure corrected daily mean count rates recorded by NMs and MDs. From top to bottom, each panel displays the percent deviation from the average of daily mean count rates in Nagoya MD vertical channel (NGY_MD_V), Syowa MD vertical channel (SYO_MD_V), Syowa NM (SYO_NM), Polar Bare NM (SOPB), and South Pole NM (SOPO), during a period between February, 2018 and October, 2019. Representative error of each data point is less than 0.1%. MD data in top two panels show clear seasonal variations due to the atmospheric temperature effect. Minor tick marks on the horizontal axis are indicated every 27 days.
Current usage metrics show cumulative count of Article Views (full-text article views including HTML views, PDF and ePub downloads, according to the available data) and Abstracts Views on Vision4Press platform.
Data correspond to usage on the plateform after 2015. The current usage metrics is available 48-96 hours after online publication and is updated daily on week days.
Initial download of the metrics may take a while.