Open Access
Fig. 1
Download original image
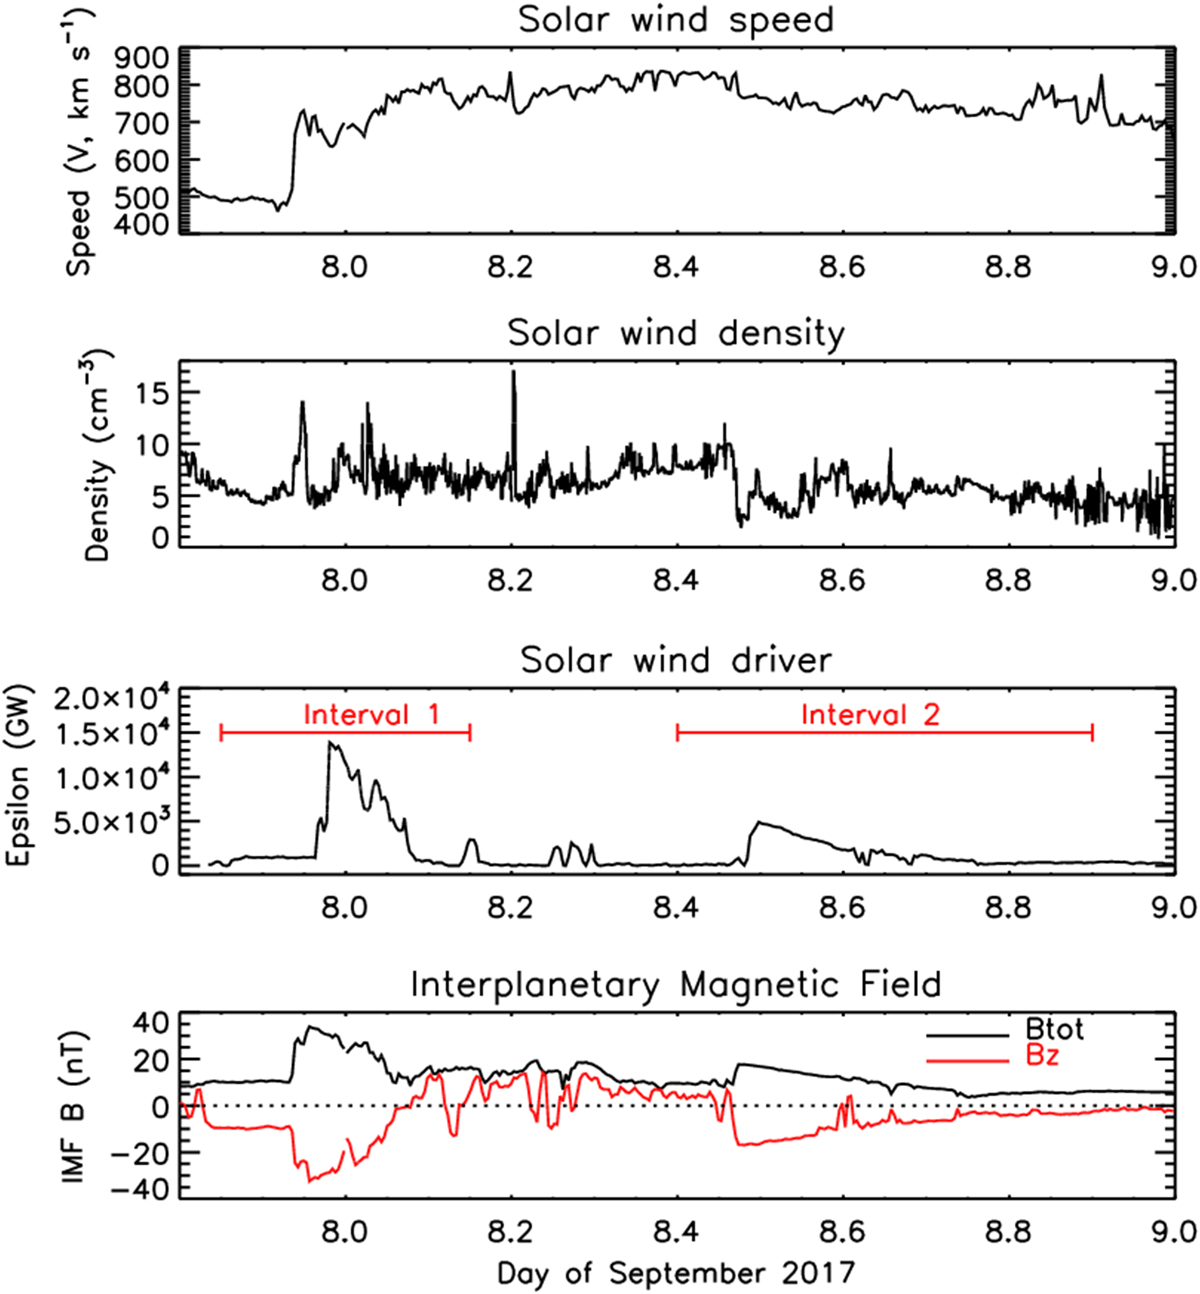
A summary plot of the solar wind and geomagnetic conditions during the disturbed period in September 2017. DSCOVR solar wind speed and density are shown in the upper two panels, solar wind epsilon factor and IMF magnetic field components (B tot and B z ) in the lower two panels.
Current usage metrics show cumulative count of Article Views (full-text article views including HTML views, PDF and ePub downloads, according to the available data) and Abstracts Views on Vision4Press platform.
Data correspond to usage on the plateform after 2015. The current usage metrics is available 48-96 hours after online publication and is updated daily on week days.
Initial download of the metrics may take a while.