Fig. 2
Download original image
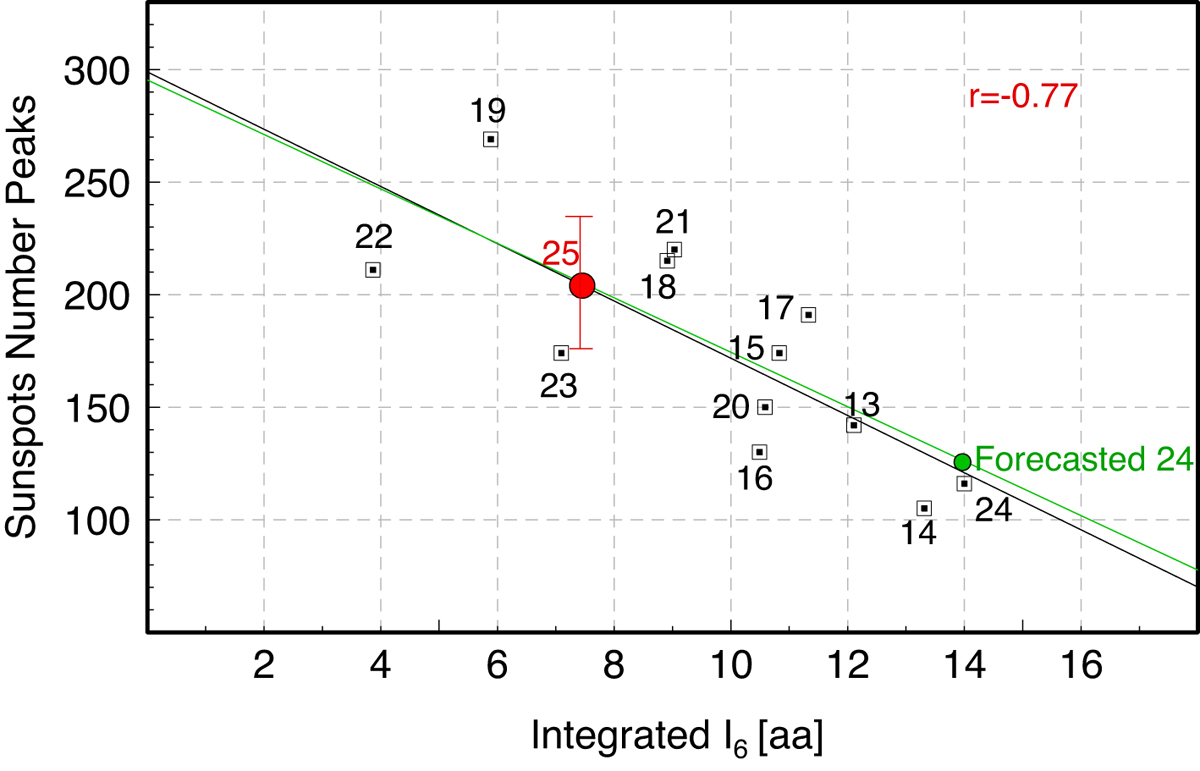
As in Figure 1, the linear regression of I6[aa] integrated over the descending phase of each solar cycle versus the sunspot peaks of the following cycle. The expected peak of SC 25 is represented by the red circle (confidence level is obtained as root mean square error). Green circle represents SC 24 forecasted by using the regression computed over SCs from 14 to 23 (represented by the green line).
Current usage metrics show cumulative count of Article Views (full-text article views including HTML views, PDF and ePub downloads, according to the available data) and Abstracts Views on Vision4Press platform.
Data correspond to usage on the plateform after 2015. The current usage metrics is available 48-96 hours after online publication and is updated daily on week days.
Initial download of the metrics may take a while.