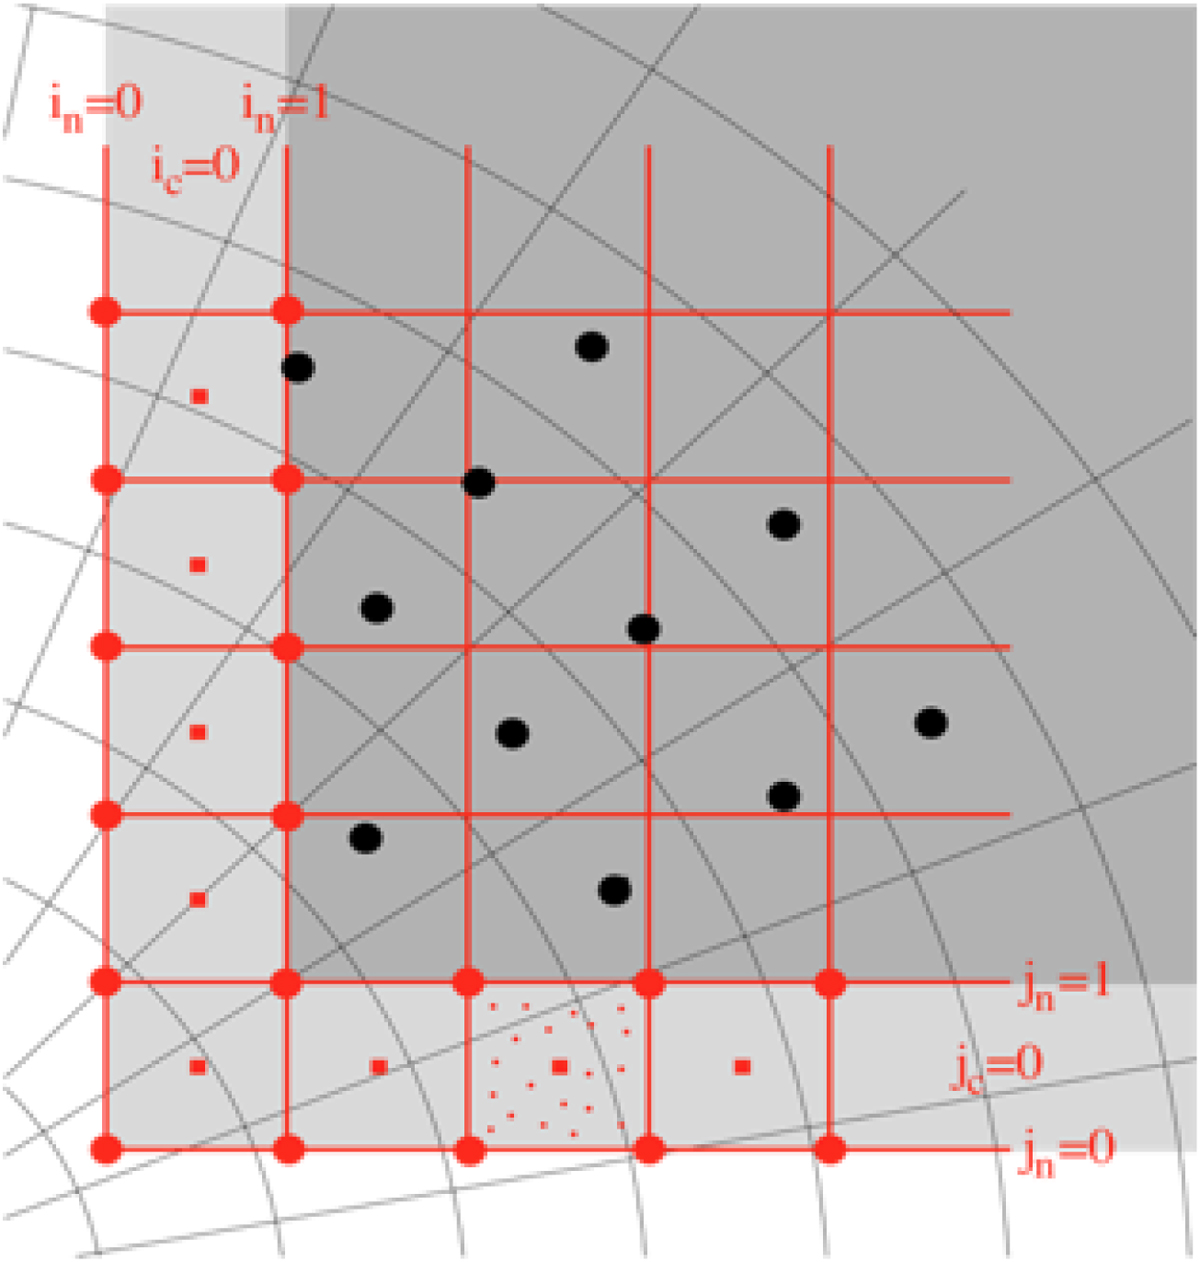
Fig. E.2

Download original image
Spatial discretization of the MHD-EPIC coupling. The Cartesian grid of the PIC region is indicated with the darker gray area. The lighter gray area shows the ghost cell/node region of the PIC grid. The large red dots are node values obtained from the MHD variables. The small red dots illustrate particles created in the ghost cells of the PIC grid. The small red squares are the ghost cell centers of the PIC grid where the magnetic field is set from the MHD solution. The black dots indicate the MHD cell centers where the solution is obtained from the PIC code. The MHD grid can be either Cartesian or spherical (after Chen et al., 2017).
Current usage metrics show cumulative count of Article Views (full-text article views including HTML views, PDF and ePub downloads, according to the available data) and Abstracts Views on Vision4Press platform.
Data correspond to usage on the plateform after 2015. The current usage metrics is available 48-96 hours after online publication and is updated daily on week days.
Initial download of the metrics may take a while.


