Fig. 7

Download original image
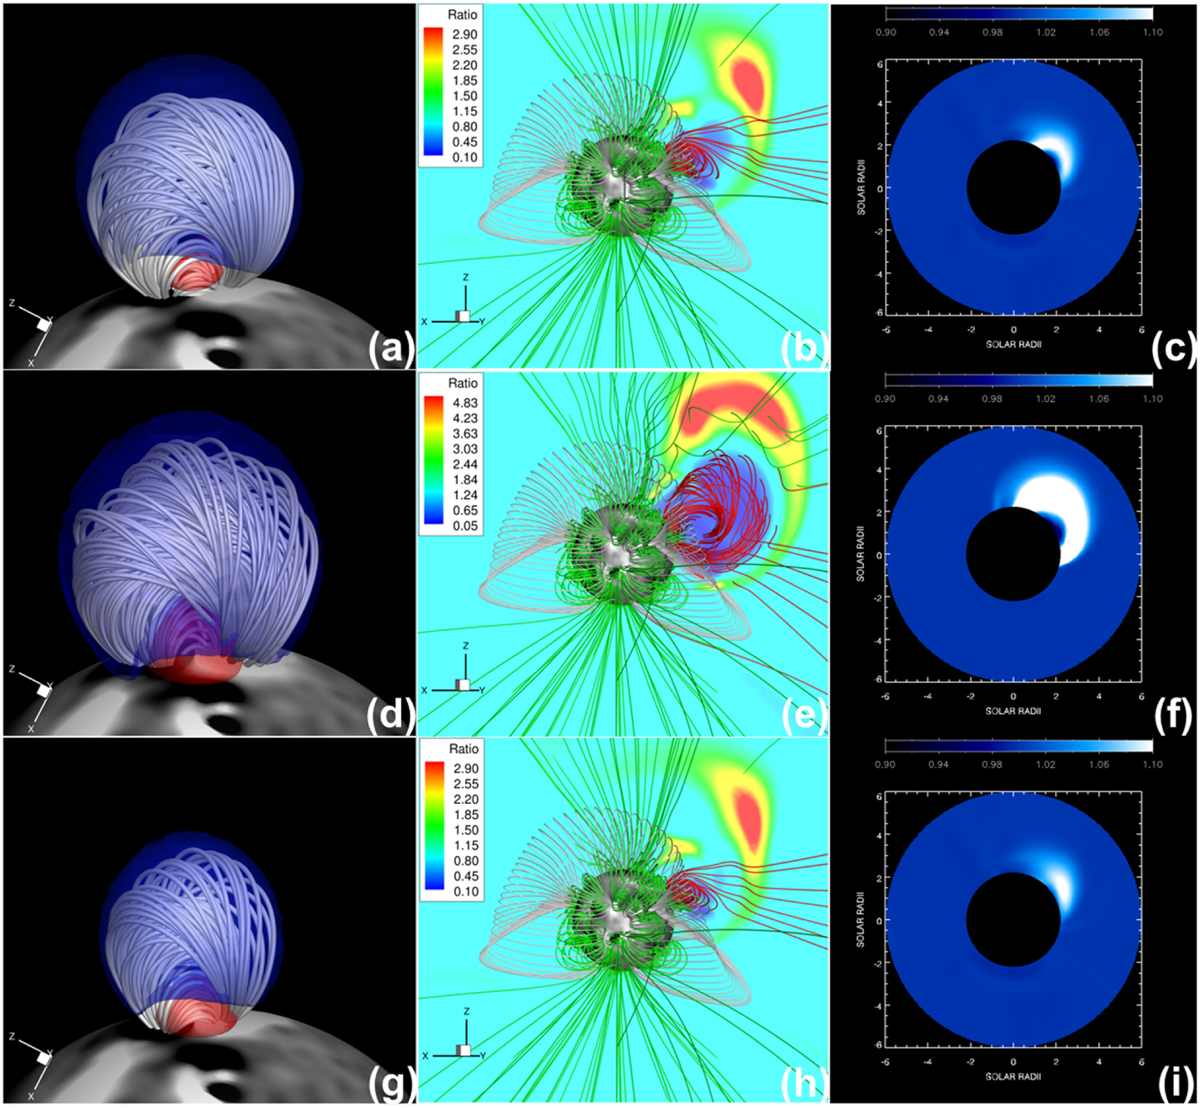
Three examples of Gibson & Low (1998) flux ropes with different size and magnetic strength parameters. Panels (a)–(f) and (g)–(i) show, respectively, flux ropes specified with radii of 0.8 and 0.6 Rs. Strength parameters are set to 0.6 for model run (a)–(c) and 2.25 for (d)–(i). The left column shows the initial configuration of the flux ropes with blue and red isosurfaces showing, respectively, the ratios of 0.3 and 2.5 of the mass density of the CME model divided by that of the pre-event corona. The middle column shows the resulting CME evolution at t = 20 min. Here, magnetic field lines are colored red, gray-shaded and green to illustrate the flux rope, large-scale helmet streamers, and magnetic fields surrounding active regions and open flux. Color contour images show the ratio of the mass density of the CME divided by that of the pre-event corona. The right column shows model-produced SOHO/LASCO white light images, where the total brightness is normalized by dividing by that of the pre-event background solar wind (from Jin et al., 2017a).
Current usage metrics show cumulative count of Article Views (full-text article views including HTML views, PDF and ePub downloads, according to the available data) and Abstracts Views on Vision4Press platform.
Data correspond to usage on the plateform after 2015. The current usage metrics is available 48-96 hours after online publication and is updated daily on week days.
Initial download of the metrics may take a while.


