Fig. 6
Download original image
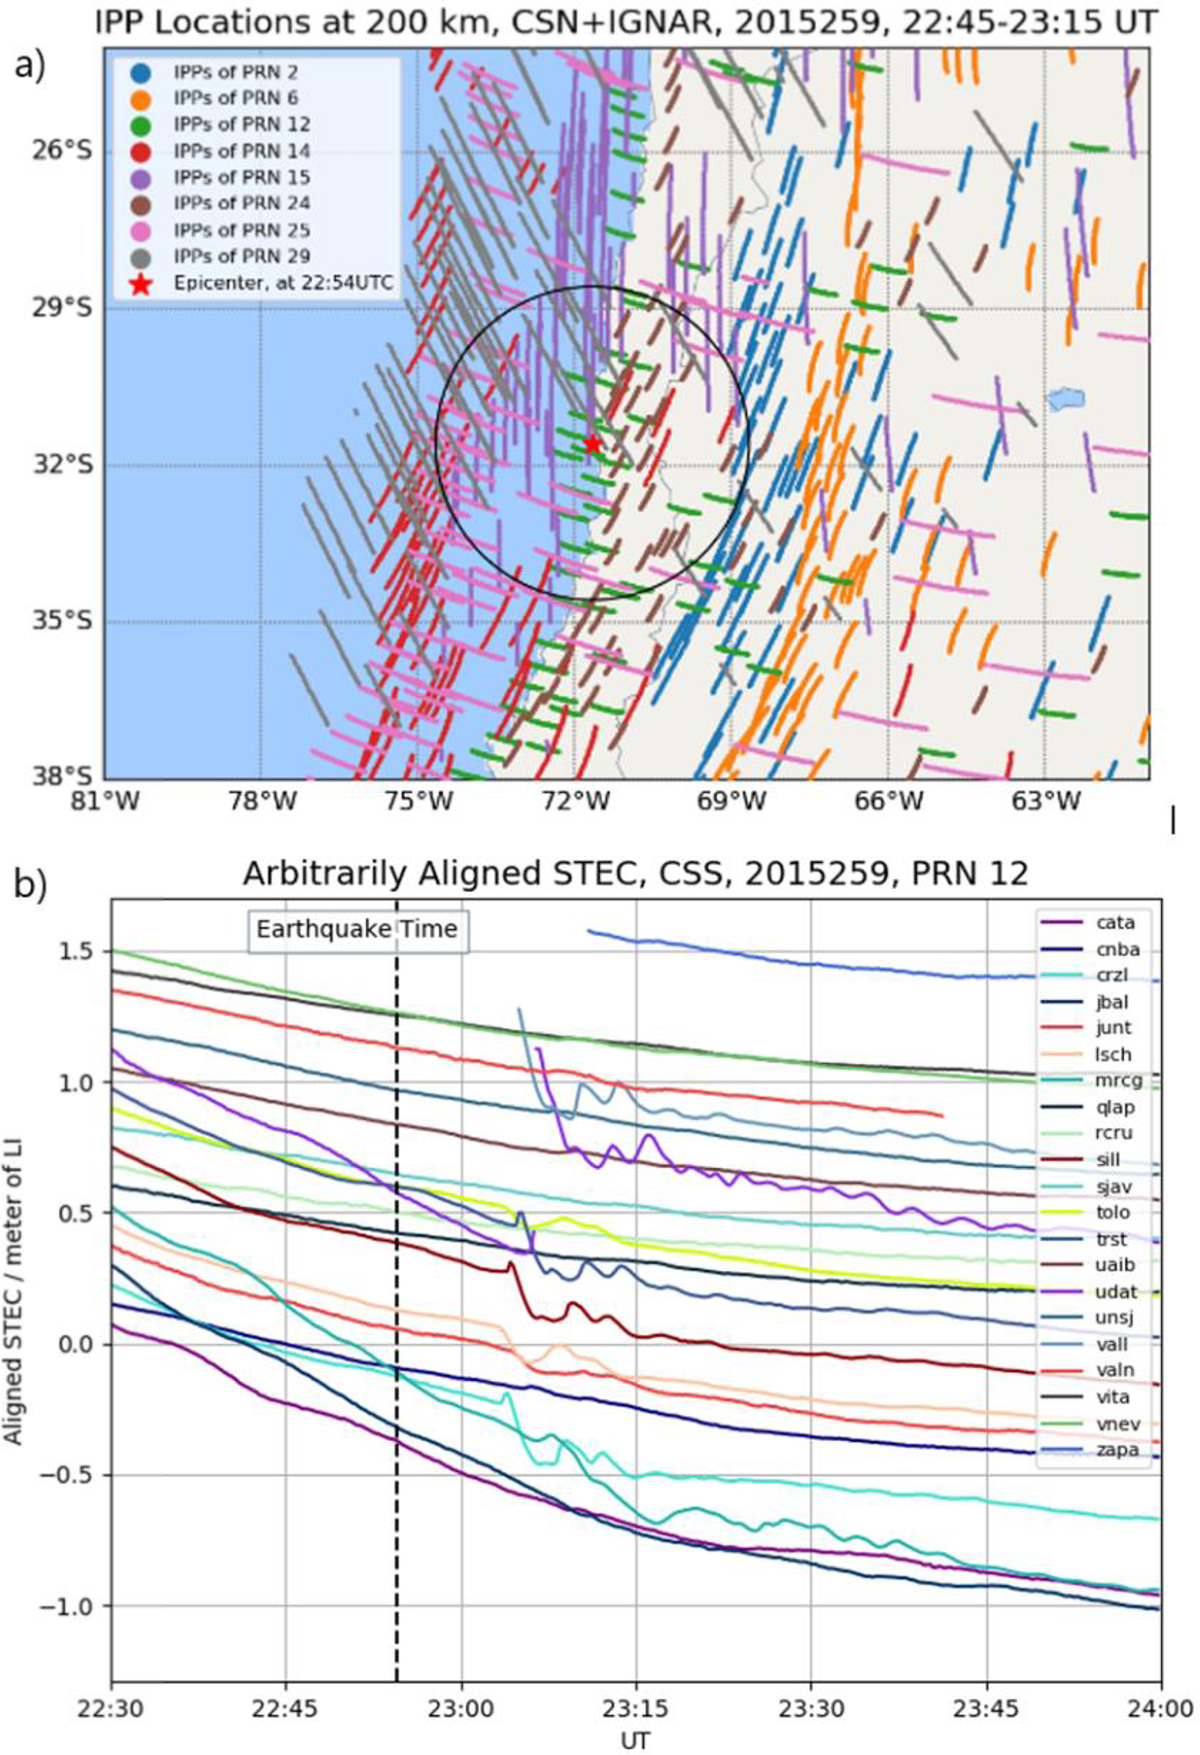
(a) IPP locations at the height of 200 km, corresponding to the GNSS receivers, from 22:45 to 23:15 UTC, the color codes of cycles for the IPP locations of different GPS satellites, the red star for the location of epicenter, (b) time evolution of the arbitrarily aligned slant TECs, for the GPS satellite of PRN 12, at the time of 22:30–24:00 UTC, the color codes of lines correspond to different GNSS receivers, the black dash line indicates the time of the EQ at 22:54 UTC.
Current usage metrics show cumulative count of Article Views (full-text article views including HTML views, PDF and ePub downloads, according to the available data) and Abstracts Views on Vision4Press platform.
Data correspond to usage on the plateform after 2015. The current usage metrics is available 48-96 hours after online publication and is updated daily on week days.
Initial download of the metrics may take a while.