Fig. 1
Download original image
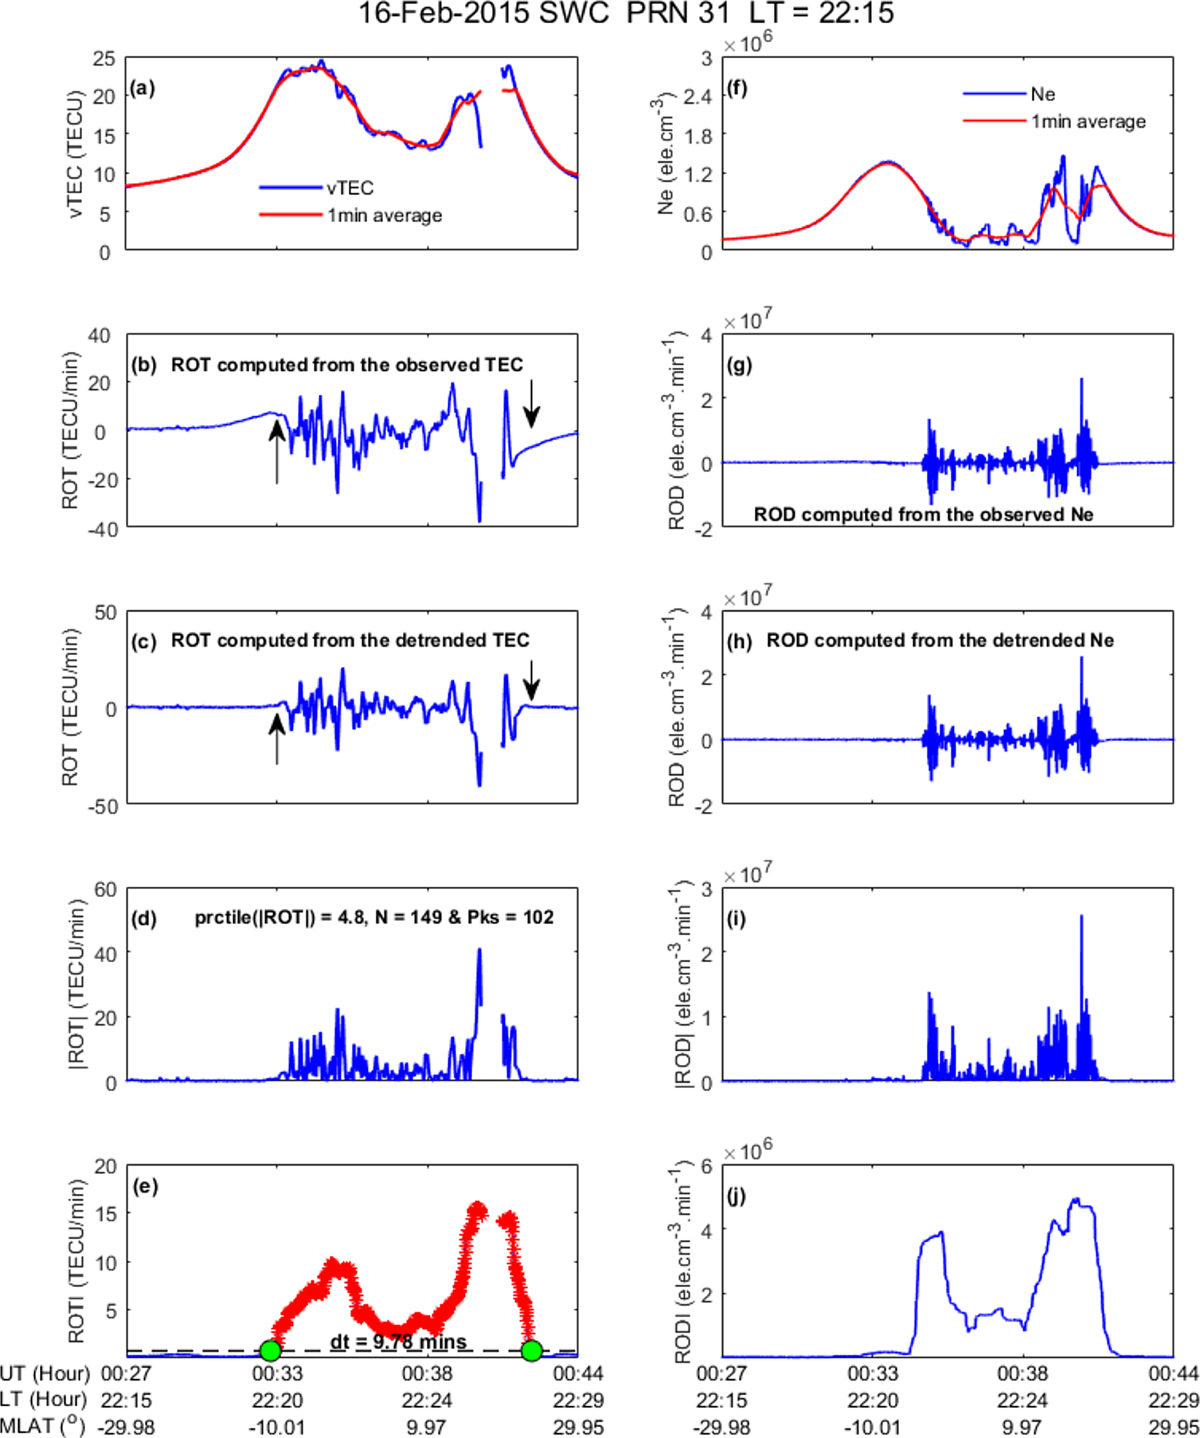
An example illustrating the occurrence of ionospheric irregularities on 16 February 2015 observed by Swarm-C along the line of sight of GPS PRN 31 around 22:14 LT. (a) and (f) The observed (blue) and the 1-min running average (red) vTEC and Ne data, respectively. (b) and (g) The rate of TEC (ROT) and rate of Ne (ROD) obtained from the observed vTEC and Ne, respectively. (c) and (h) ROT and ROD obtained from the detrended TEC and Ne, respectively. (d) and (i) The absolute values of detrended ROT and ROD, and (e) and (j) the values of the rate of TEC index (ROTI) and rate of Ne index (RODI). The prctile(|ROT|) in Figure 1d refers to the value of the 25th and 75th inter-percentile range of the detrended |ROT| when ROTI ≥ 0.75 TECU/min, N is the corresponding data population and Pks is the number of peaks (local maxima) in |ROT| when ROTI ≥ 0.75 TECU/min. The horizontal dashed black line indicates ROTI = 0.75 TECU/min, and dt is the time interval (the start and end indicated by the two green solid circle) when ROTI ≥ 0.75 TECU/min (red).
Current usage metrics show cumulative count of Article Views (full-text article views including HTML views, PDF and ePub downloads, according to the available data) and Abstracts Views on Vision4Press platform.
Data correspond to usage on the plateform after 2015. The current usage metrics is available 48-96 hours after online publication and is updated daily on week days.
Initial download of the metrics may take a while.