Fig. 10
Download original image
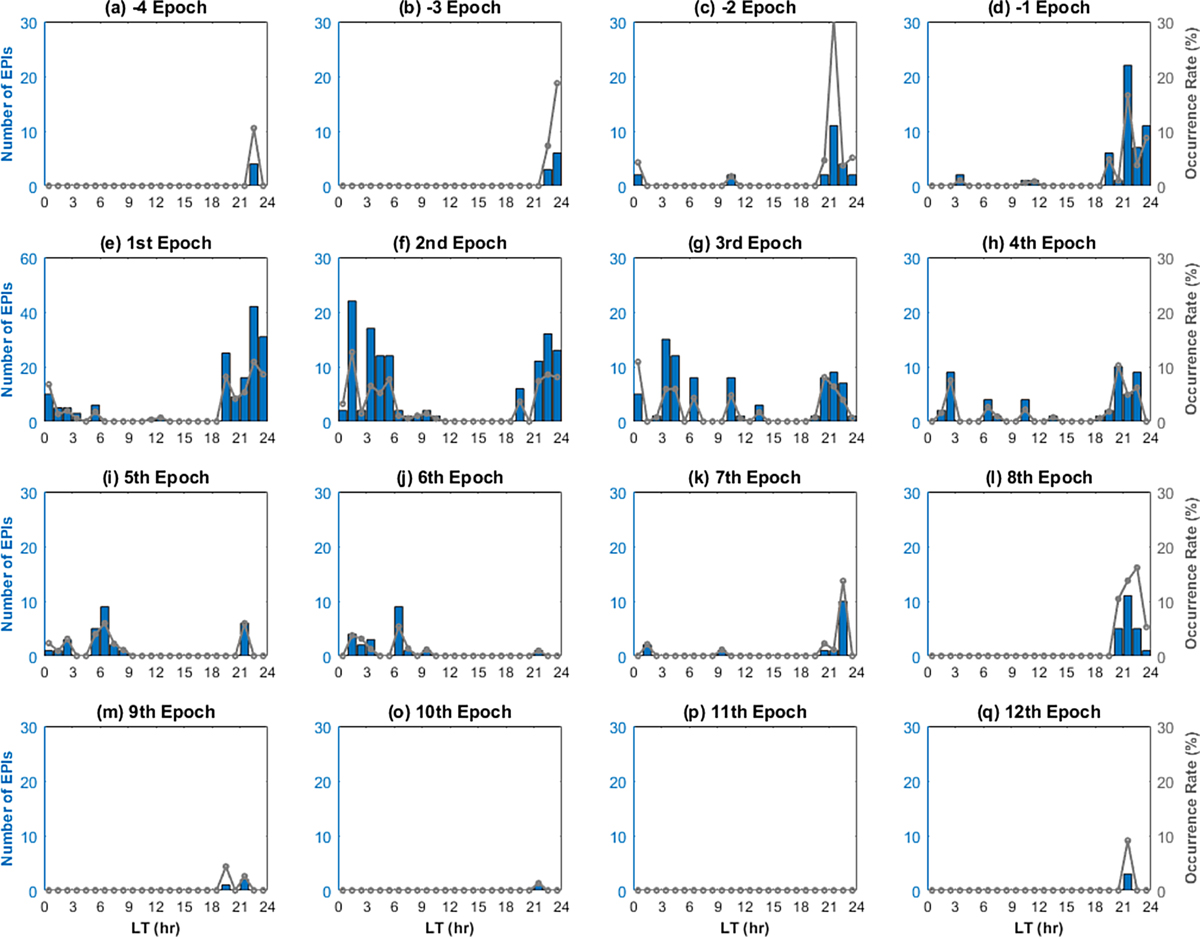
The LT distribution of the numbers of EPIs (blue bars) and percentage occurrence rate (gray curves) during different epochs of the superposed storms. (a)–(d) and (e)–(q) show the epochs before and after the main phase onset (each epoch lasts for 6 h).
Current usage metrics show cumulative count of Article Views (full-text article views including HTML views, PDF and ePub downloads, according to the available data) and Abstracts Views on Vision4Press platform.
Data correspond to usage on the plateform after 2015. The current usage metrics is available 48-96 hours after online publication and is updated daily on week days.
Initial download of the metrics may take a while.