Fig. 5
Download original image
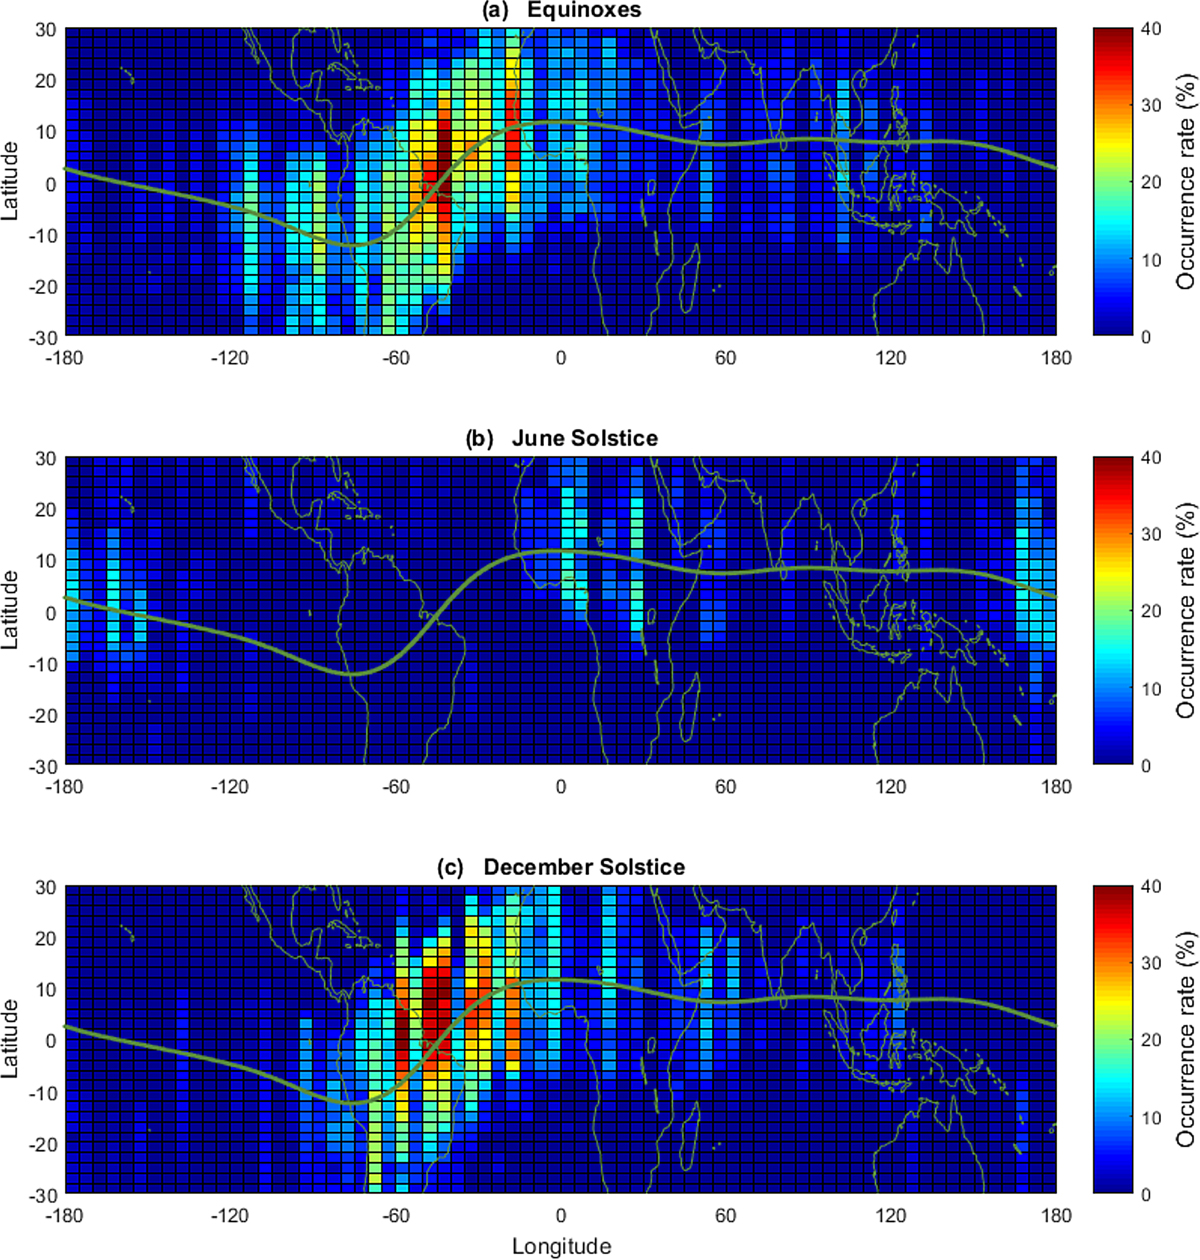
The occurrence rate of the equatorial plasma irregularities of all the combined satellites from 01 November 2014 to 31 December 2015 under kp < 4: (a) combined equinoxes (b) June solstice (c) December solstices. The gray curve represents the dip equator.
Current usage metrics show cumulative count of Article Views (full-text article views including HTML views, PDF and ePub downloads, according to the available data) and Abstracts Views on Vision4Press platform.
Data correspond to usage on the plateform after 2015. The current usage metrics is available 48-96 hours after online publication and is updated daily on week days.
Initial download of the metrics may take a while.