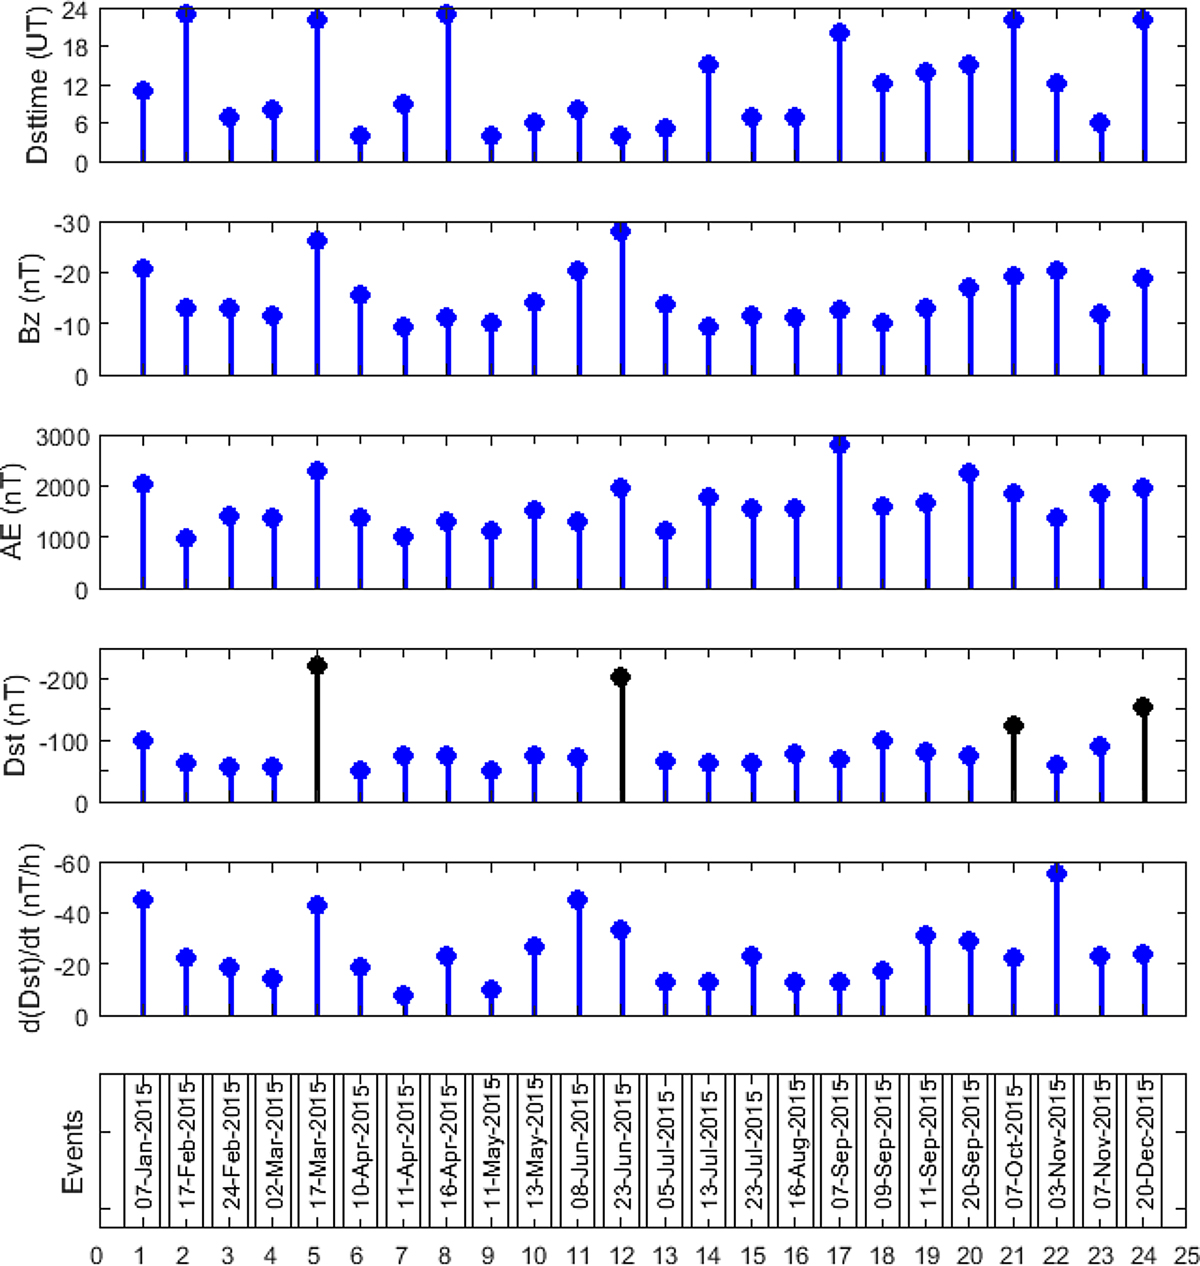
Fig. 6
Download original image
The plot of the Dst minimum time (Dsttime), minimum southward interplanetary horizontal magnetic field (Bz), the peak value of auroral electrojet (AE), minimum Dst and the rate of Dst per hour (d(Dst)/dt) values during each storm event from top to bottom. The black lines indicate the storms with Dst < −100 nT.
Current usage metrics show cumulative count of Article Views (full-text article views including HTML views, PDF and ePub downloads, according to the available data) and Abstracts Views on Vision4Press platform.
Data correspond to usage on the plateform after 2015. The current usage metrics is available 48-96 hours after online publication and is updated daily on week days.
Initial download of the metrics may take a while.