Fig. 7
Download original image
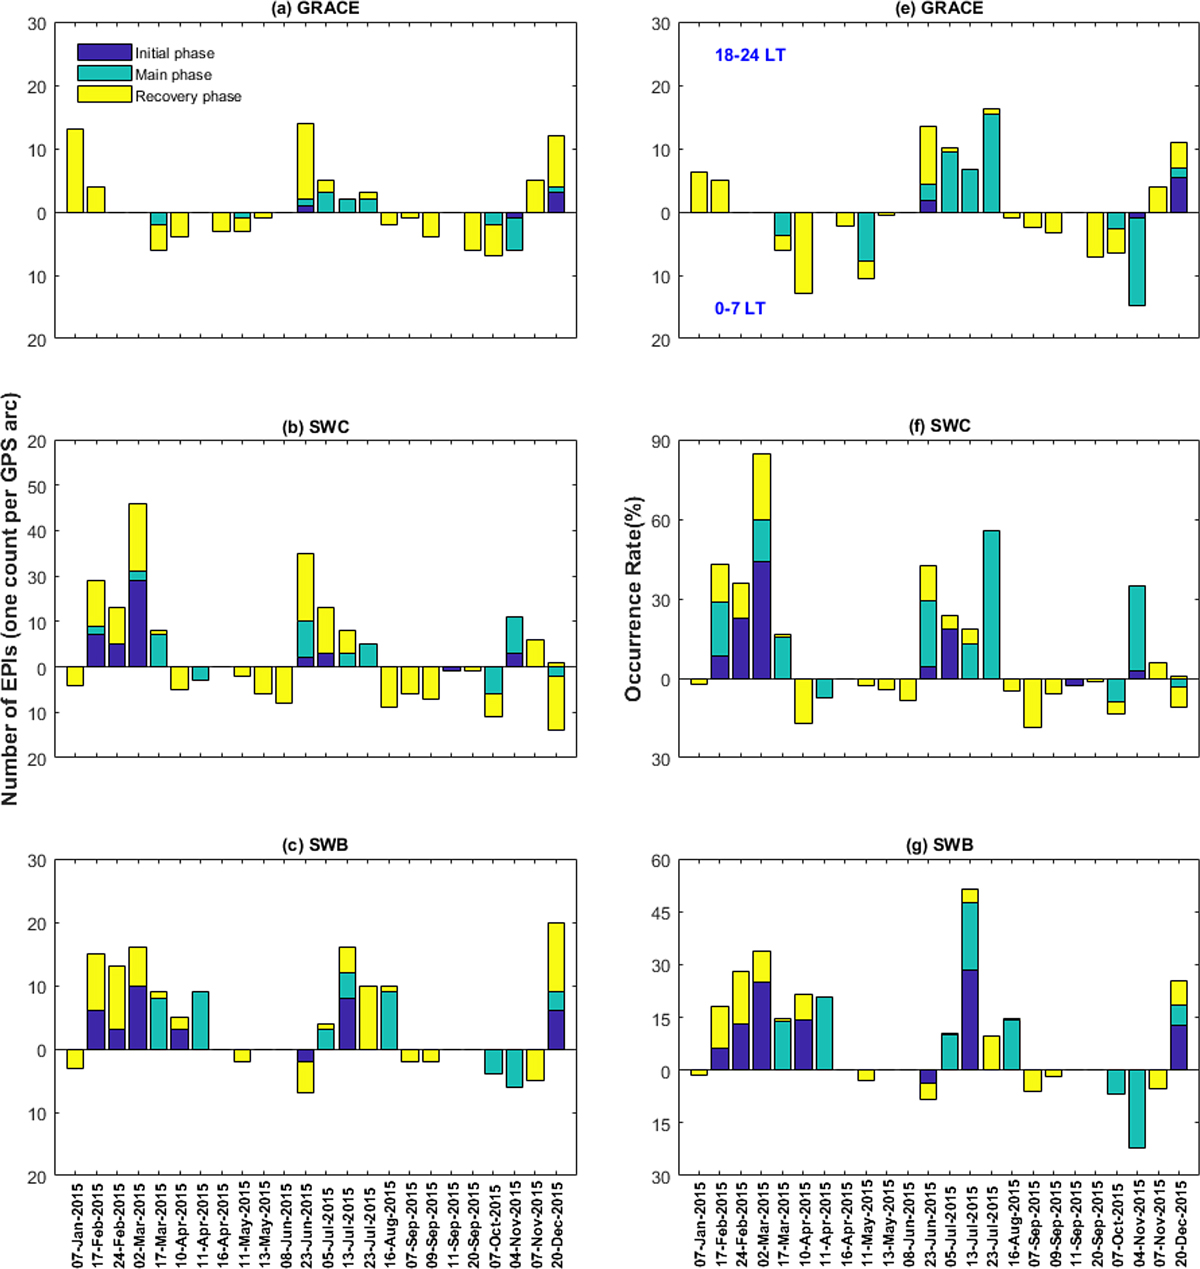
The distribution of the number of observed irregularities during each storm phase (a)–(d) and the percentage of occurrences of irregularities (e)–(h) during each storm phase is calculated from the numbers of irregularities divided by the numbers of GPS arcs. The blue bars indicate the initial phase, green bars indicate the main phase and the yellow bars indicate the recovery phase. The upper segment of each panel (a)–(d) represents the distribution during post-sunset (18:00–24:00 LT) and the lower segment (e)–(h) during post-midnight (00:00–07:00 LT).
Current usage metrics show cumulative count of Article Views (full-text article views including HTML views, PDF and ePub downloads, according to the available data) and Abstracts Views on Vision4Press platform.
Data correspond to usage on the plateform after 2015. The current usage metrics is available 48-96 hours after online publication and is updated daily on week days.
Initial download of the metrics may take a while.