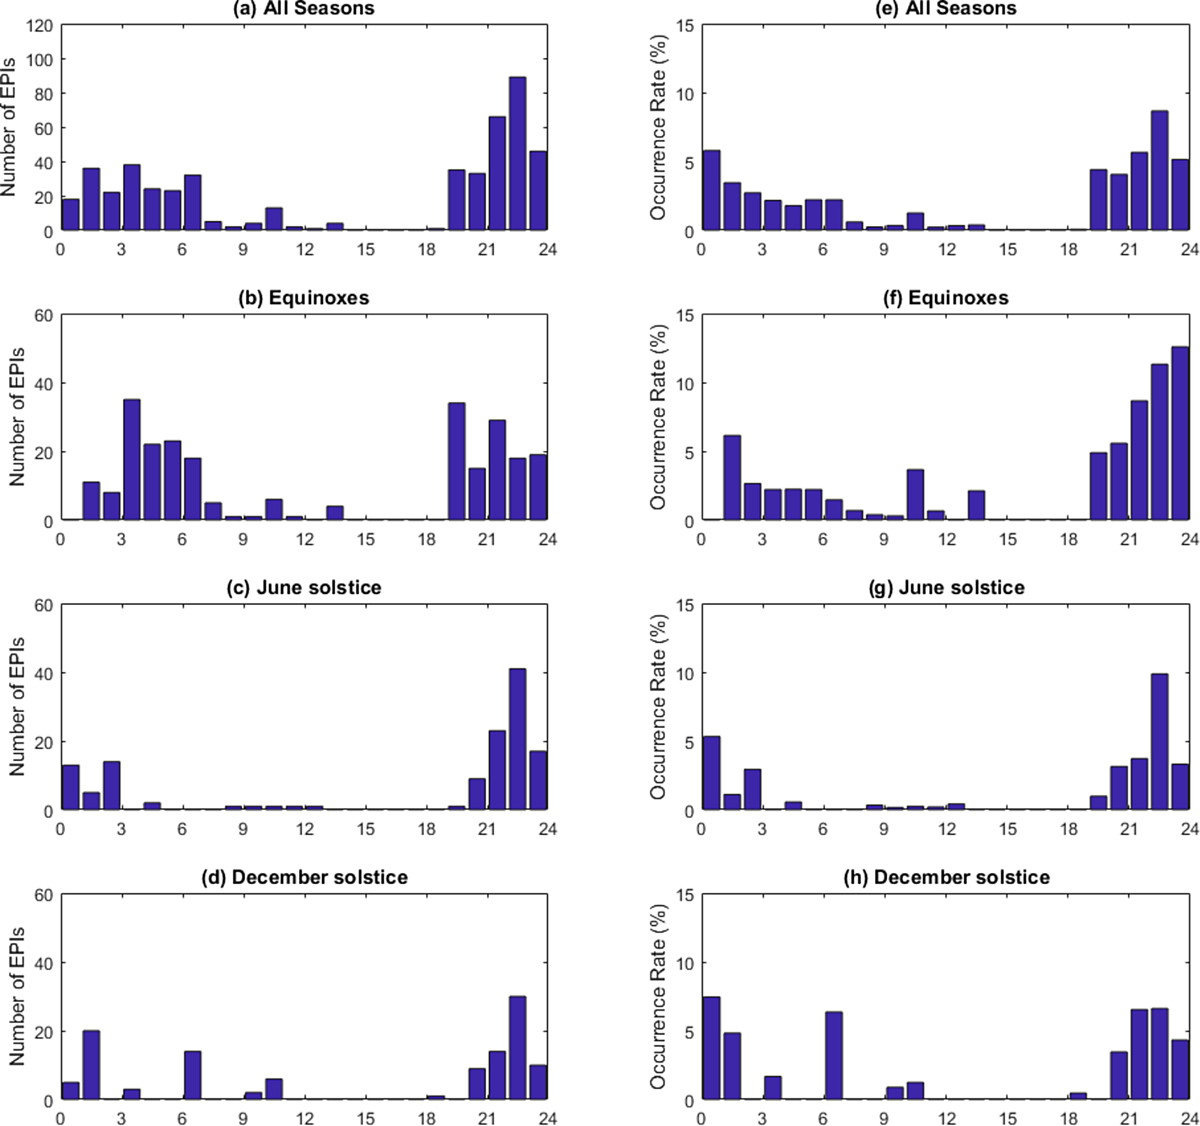
Fig. 9
Download original image
(a)–(d) The local time distributions of the storm time numbers of EPIs (e)–(h) and the percentage occurrence rate for all seasons, equinoxes, June solstice and December solstice from the top to the bottommost panel, respectively, in this order. The storm time was considered from main phase onset to the end of the recovery phase.
Current usage metrics show cumulative count of Article Views (full-text article views including HTML views, PDF and ePub downloads, according to the available data) and Abstracts Views on Vision4Press platform.
Data correspond to usage on the plateform after 2015. The current usage metrics is available 48-96 hours after online publication and is updated daily on week days.
Initial download of the metrics may take a while.