Fig. 1
Download original image
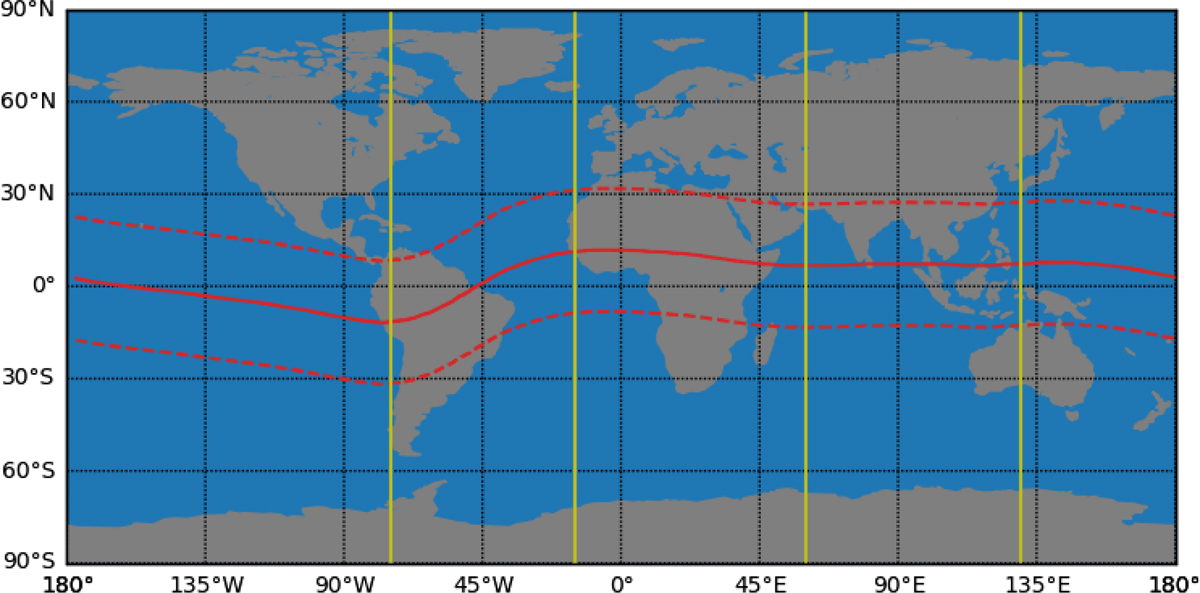
The yellow lines on this map delineate the zonal boundaries of the four sectors used for this study. The solid red line shows the magnetic equator, while the dashed red line indicates ±10° from the magnetic equator, which is used to restrict vertical plasma drift measurements. These zones are chosen to roughly correspond to regions of low variance in magnetic declination. Drift measurements and bubbles are binned together based on these zonal regions.
Current usage metrics show cumulative count of Article Views (full-text article views including HTML views, PDF and ePub downloads, according to the available data) and Abstracts Views on Vision4Press platform.
Data correspond to usage on the plateform after 2015. The current usage metrics is available 48-96 hours after online publication and is updated daily on week days.
Initial download of the metrics may take a while.