Figure 2
Download original image
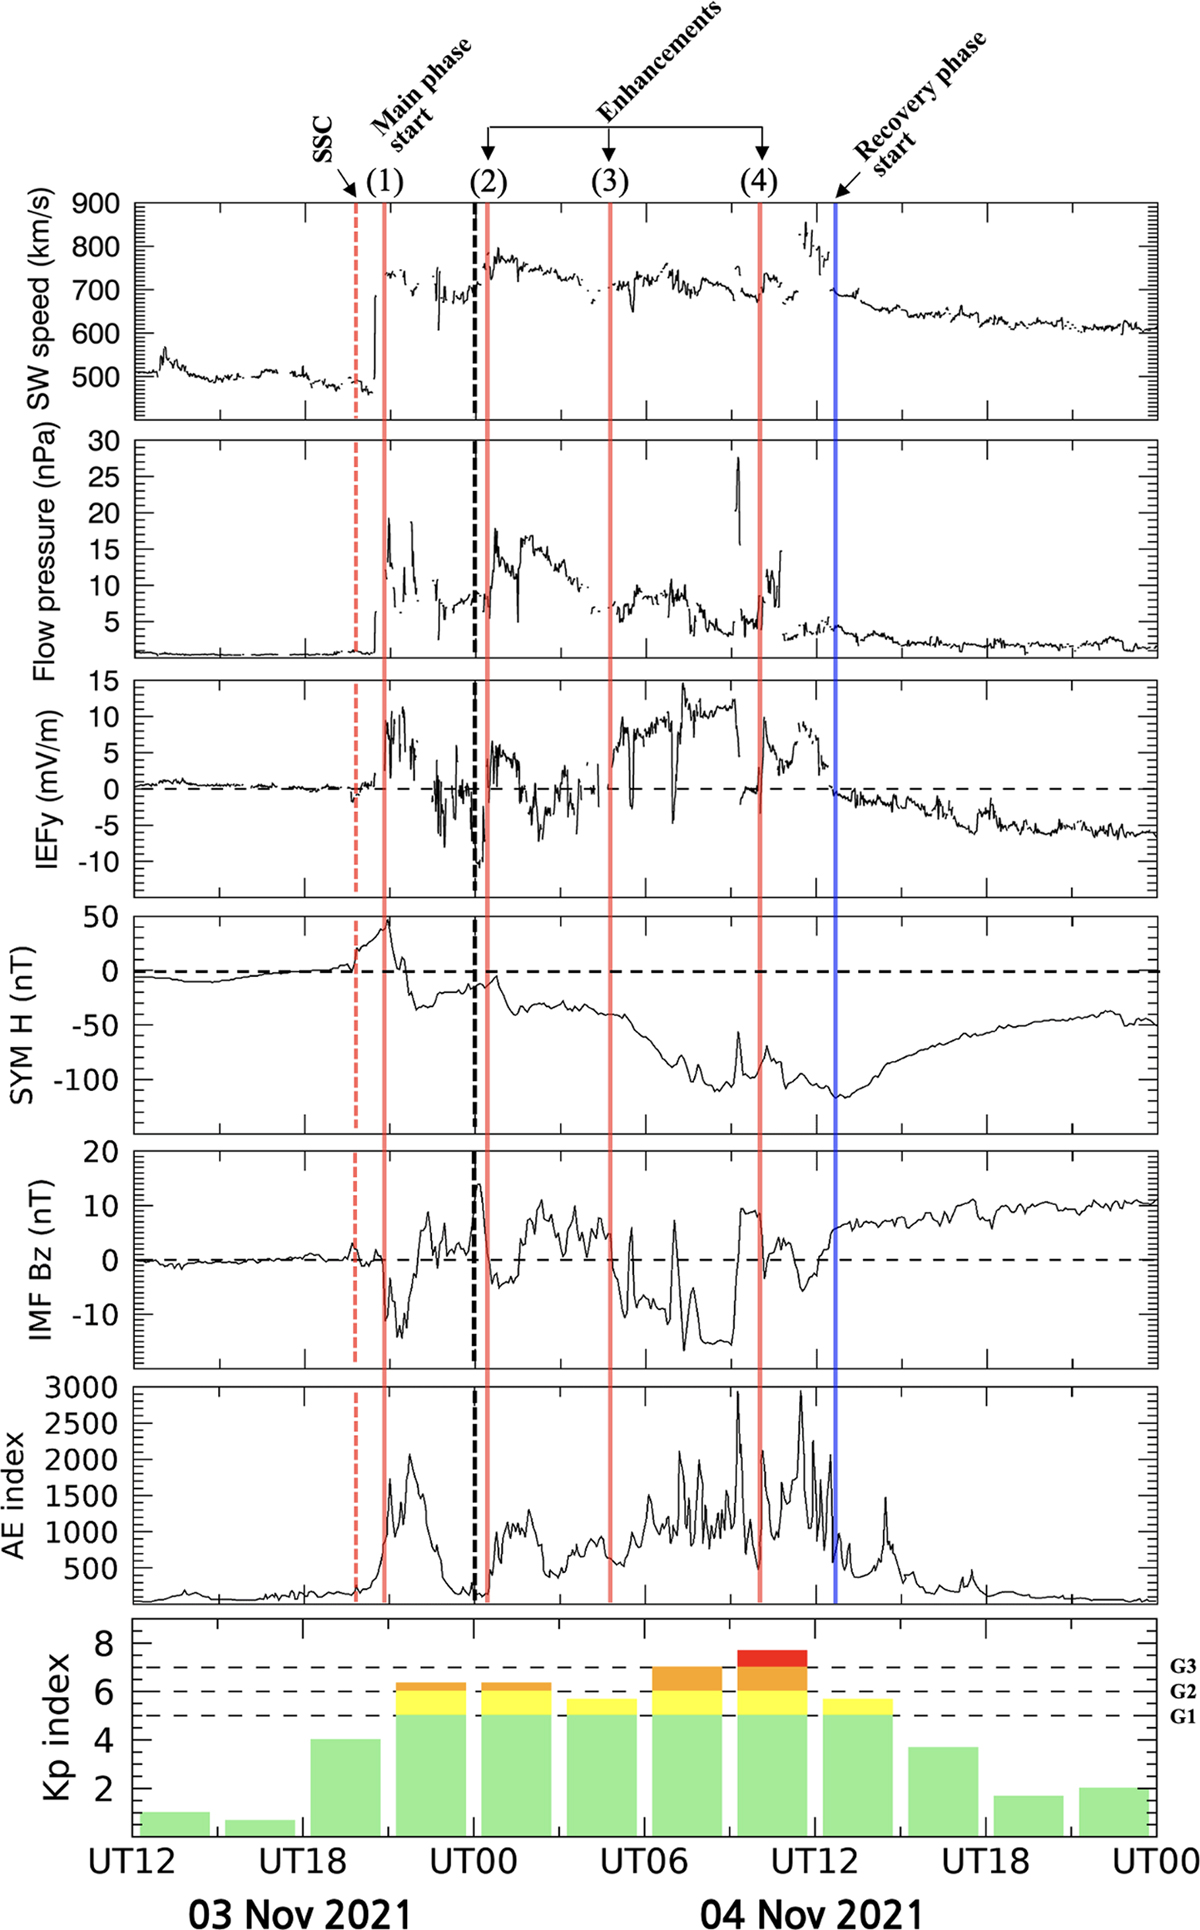
The state of the space environment during the period November 3–4, 2021, when the G3 geomagnetic storm occurred. The panels from top to bottom display the solar wind speed, flow pressure, IEFy, SYM-H, IMF Bz, AE index, and Kp index. The red vertical dashed line indicates the SSC. The first red vertical solid line (1) indicates the main phase start of the geomagnetic storm triggered by type IV halo CME occurred on November 2nd. Three red vertical solid lines (2–4) indicate the enhancements of the geomagnetic storm due to subsequently arriving CMEs. The blue vertical solid line marked the recovery phase start of the storm. The black dashed vertical line indicates the date change.
Current usage metrics show cumulative count of Article Views (full-text article views including HTML views, PDF and ePub downloads, according to the available data) and Abstracts Views on Vision4Press platform.
Data correspond to usage on the plateform after 2015. The current usage metrics is available 48-96 hours after online publication and is updated daily on week days.
Initial download of the metrics may take a while.