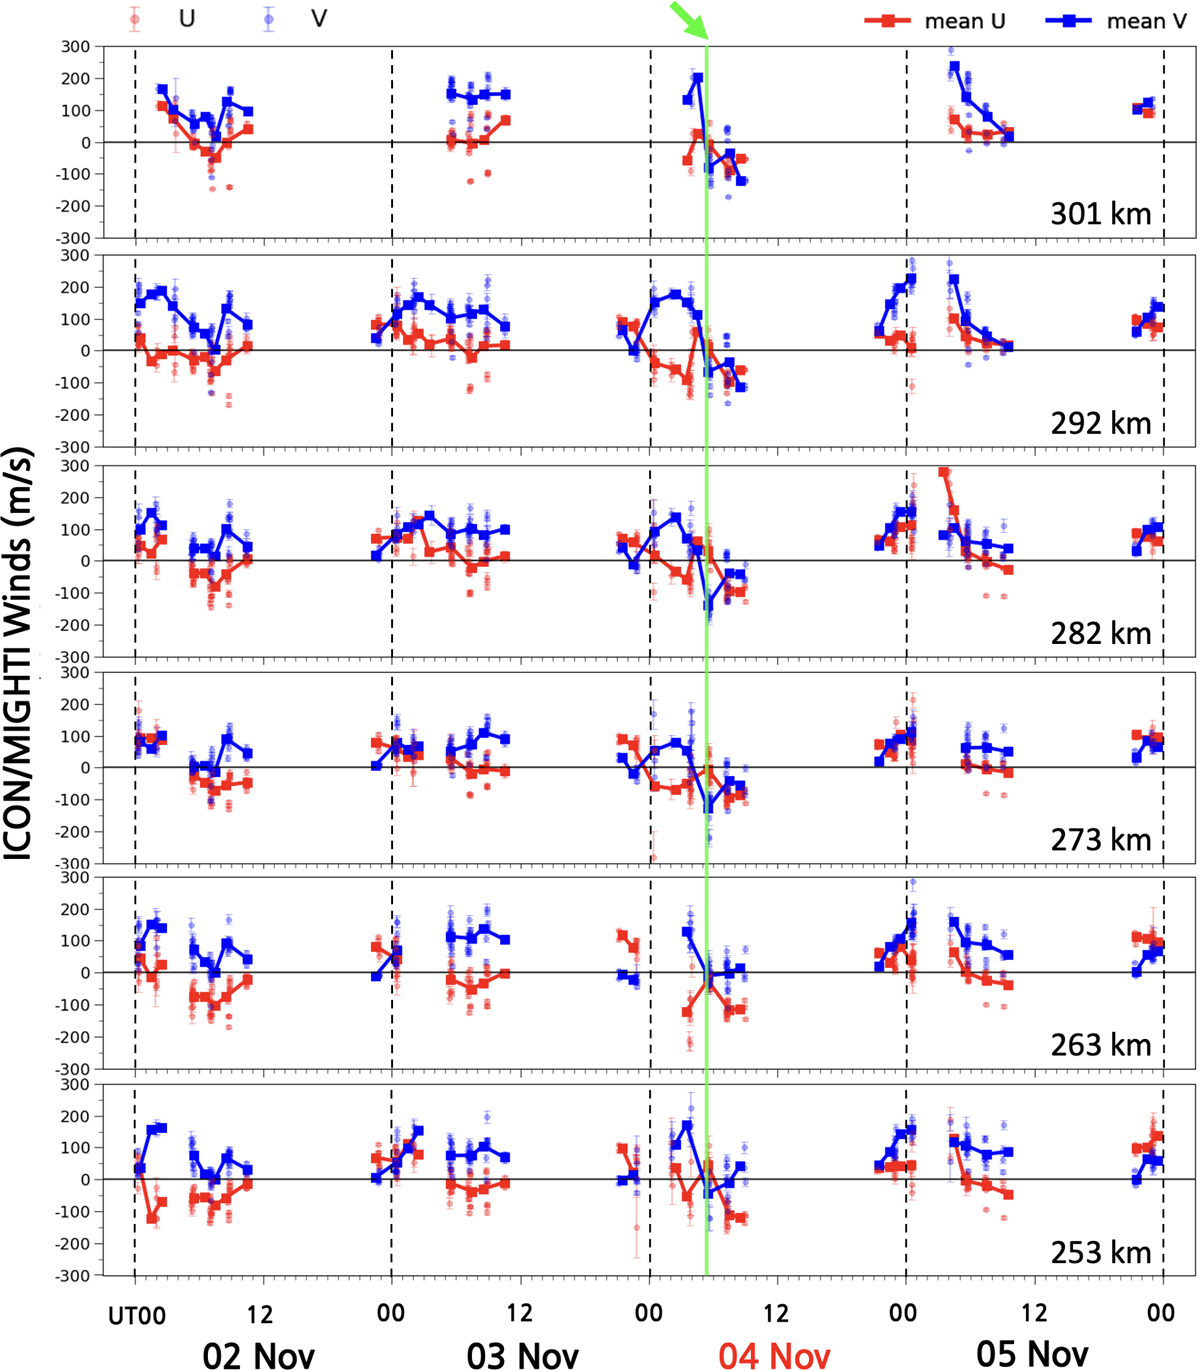
Figure 4
Download original image
The thermospheric winds presented include error bars at 253–301 km altitudes, as observed near middle latitudes by ICON/MIGHTI satellite. The square symbols represent the hourly averaged values. The vertical black dashed lines denote the points where the dates change, while the horizontal lines indicate 0 m/s for each altitude. Additionally, the green vertical line and arrow indicate significant change points in the meridional wind (U) fields.
Current usage metrics show cumulative count of Article Views (full-text article views including HTML views, PDF and ePub downloads, according to the available data) and Abstracts Views on Vision4Press platform.
Data correspond to usage on the plateform after 2015. The current usage metrics is available 48-96 hours after online publication and is updated daily on week days.
Initial download of the metrics may take a while.