Figure 6
Download original image
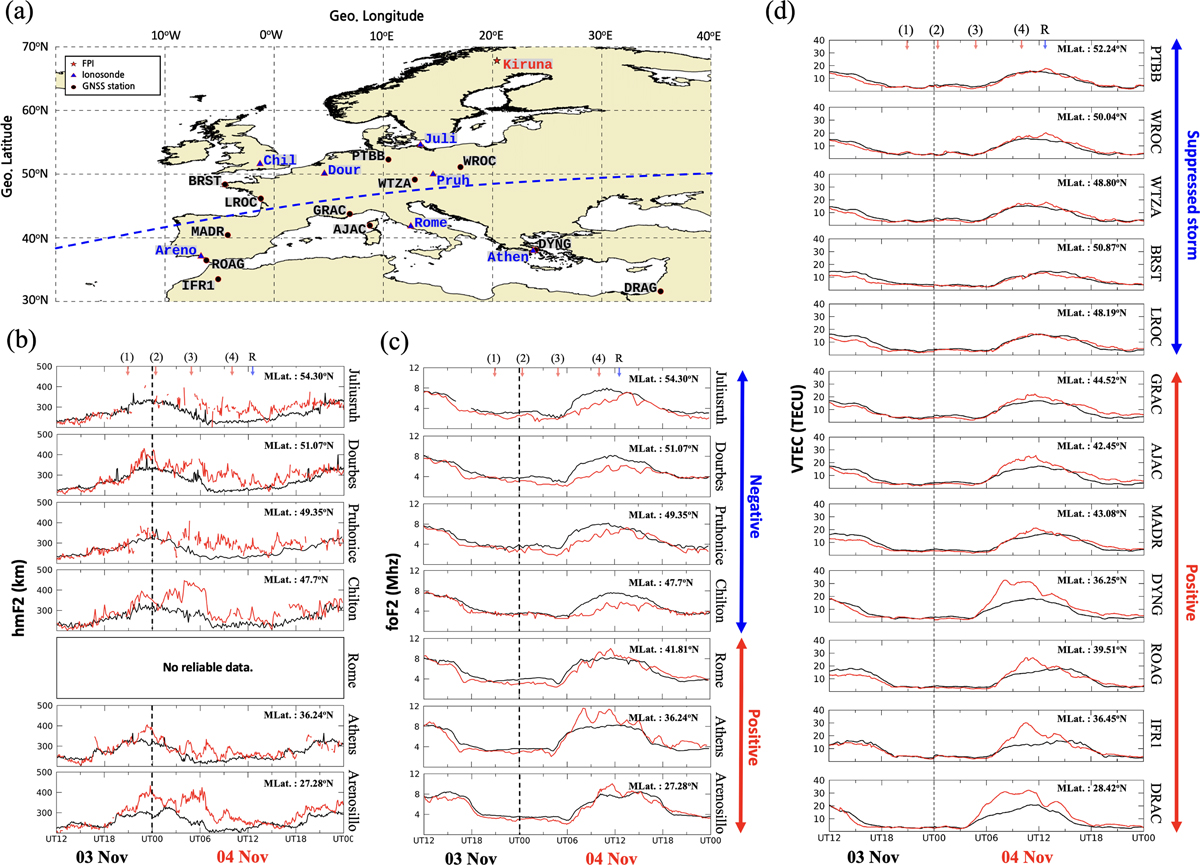
(a) Locations of observation equipment used over Europe. The blue dashed line is the imaginary boundary where the pattern of the ionosphere storm changes. (b) and (c) Variations in hmF2 and foF2 values from ionosondes. The black solid lines represent the IQD reference day and the red ones are those on the event days. (d) Variations in VTEC values from GNSS receivers. The (1)–(4) and R markers indicated at the top of (b)–(d), along with the storm phases used in Figure 2 illustrate the state of geomagnetic storms.
Current usage metrics show cumulative count of Article Views (full-text article views including HTML views, PDF and ePub downloads, according to the available data) and Abstracts Views on Vision4Press platform.
Data correspond to usage on the plateform after 2015. The current usage metrics is available 48-96 hours after online publication and is updated daily on week days.
Initial download of the metrics may take a while.