Figure 4
Download original image
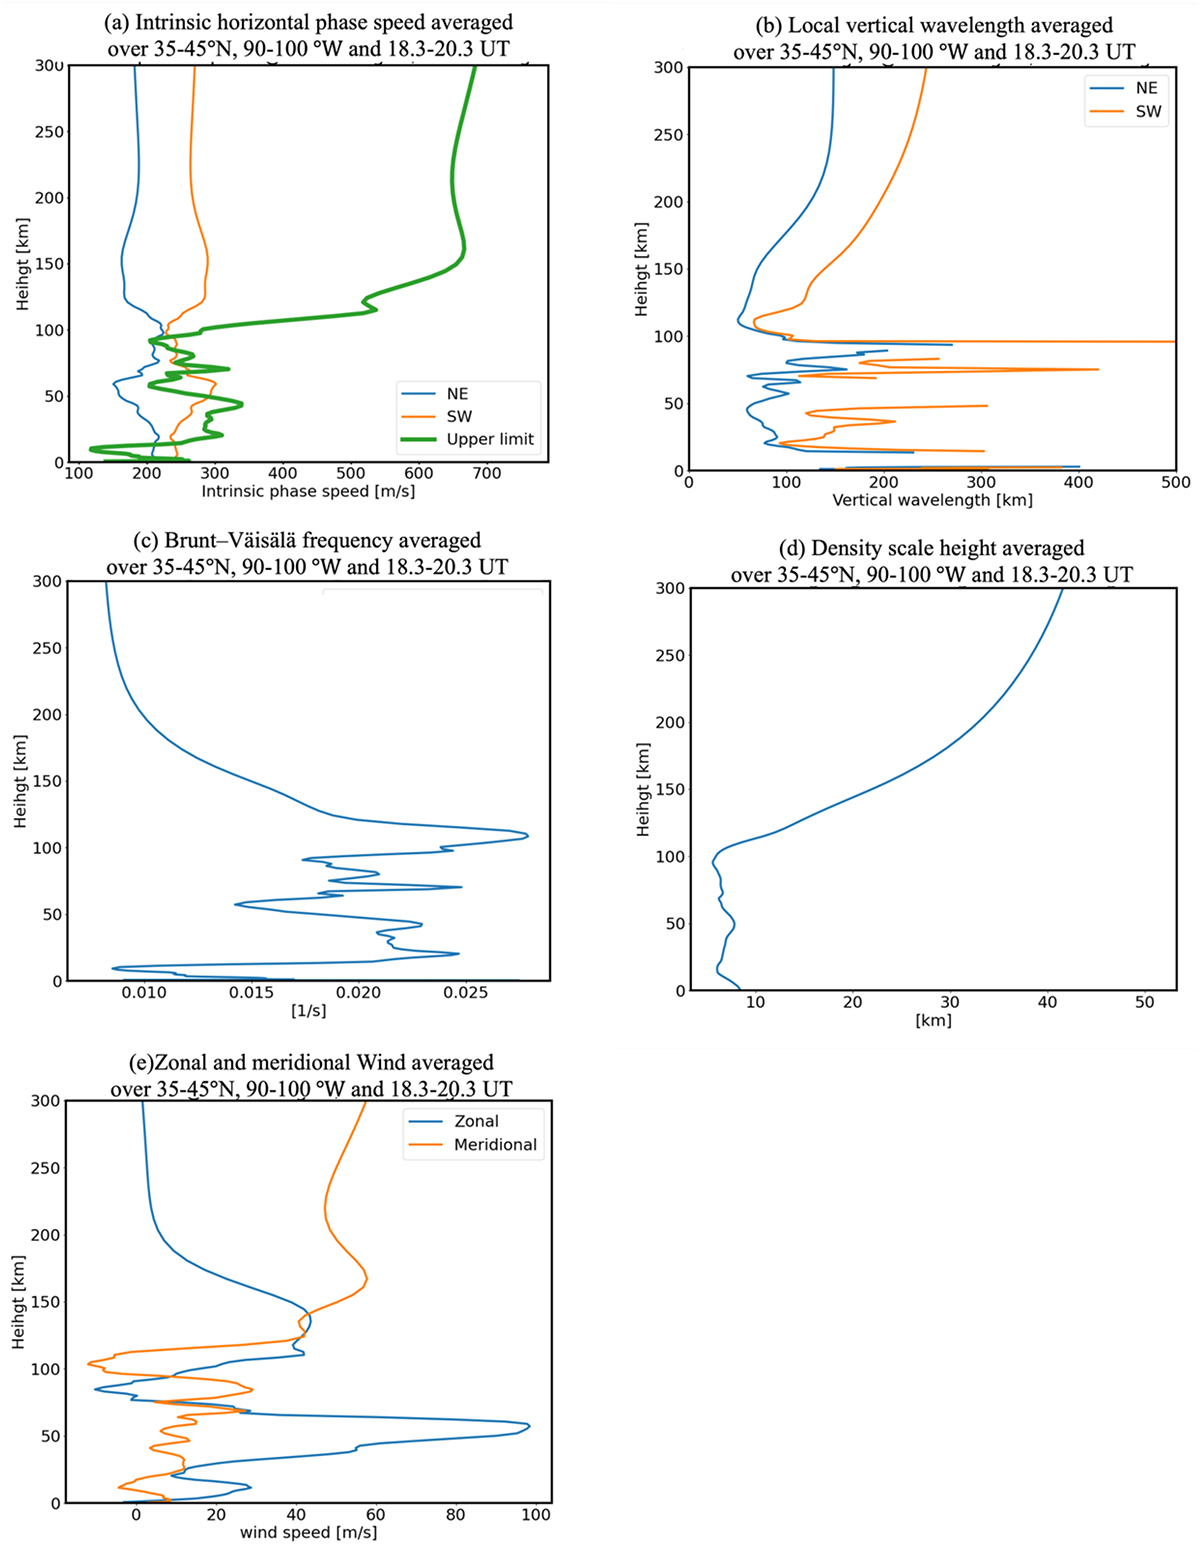
(a) Vertical profiles of GW intrinsic horizontal phase speeds. The blue and orange lines indicate the northeastward and southwestward GWs, respectively. The thick green line indicates the upper limit of intrinsic horizontal phase speed. (b) Same as (a) but local vertical wavelengths from equation (1). (c) Brunt–Väisälä frequency. (d) Density scale height. (e) Horizontal winds. These values are averaged over 35–45°N, 90–100°W, and 18.3–20.3 UT on 20 October 2020.
Current usage metrics show cumulative count of Article Views (full-text article views including HTML views, PDF and ePub downloads, according to the available data) and Abstracts Views on Vision4Press platform.
Data correspond to usage on the plateform after 2015. The current usage metrics is available 48-96 hours after online publication and is updated daily on week days.
Initial download of the metrics may take a while.