Open Access
Figure 6
Download original image
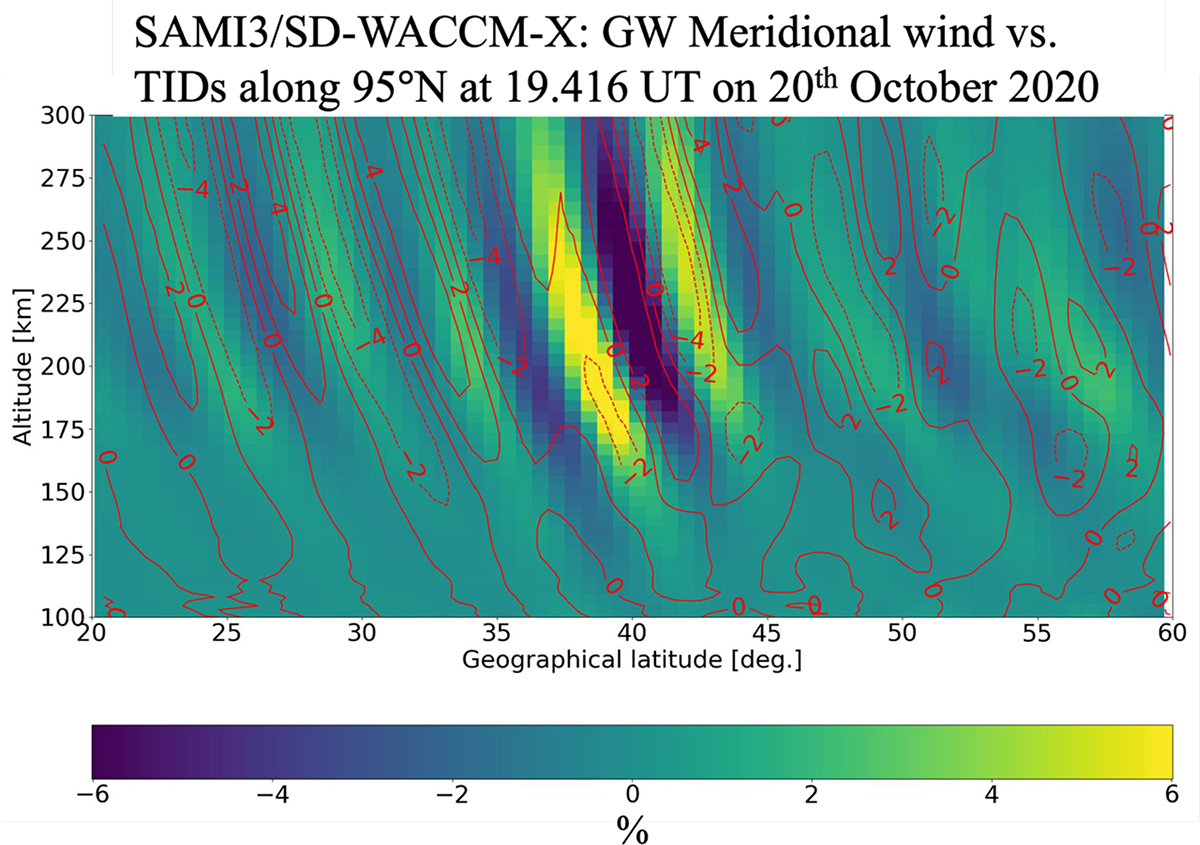
The color plots denote electron density perturbations in SAMI3/SD-WACCM-X (a) along 95°W at 19.416 UT (13.086 LT) on 20th October 2020. The red contours denote the meridional wind perturbations (m·s−1) in SD-WACCM-X.
Current usage metrics show cumulative count of Article Views (full-text article views including HTML views, PDF and ePub downloads, according to the available data) and Abstracts Views on Vision4Press platform.
Data correspond to usage on the plateform after 2015. The current usage metrics is available 48-96 hours after online publication and is updated daily on week days.
Initial download of the metrics may take a while.