Figure 5

Download original image
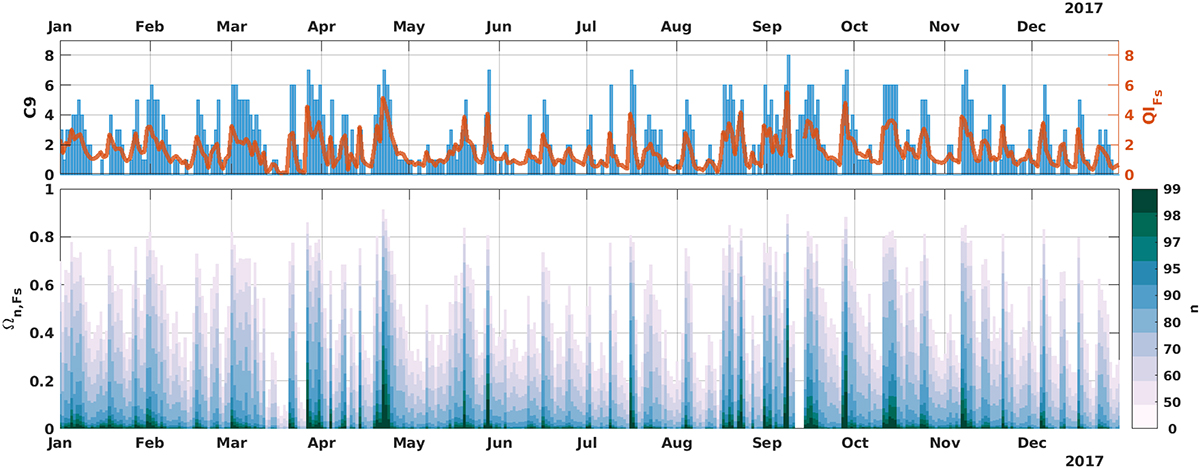
Fs indices for the year 2017 using Swarm B Level1b OPER data. The top panel overplots the daily quantile index, QIB(ψ) (Eq. 7) with C9 (a daily estimate of Kp). The bottom panel shows the daily exceedance parameter, ![]() , associated with the daily magnetic field intensity for the year 2017 (Eq. 5). Overplotted coloured bars indicate the proportion of bins in exceedance of the nth quantile. See text for further details.
, associated with the daily magnetic field intensity for the year 2017 (Eq. 5). Overplotted coloured bars indicate the proportion of bins in exceedance of the nth quantile. See text for further details.
Current usage metrics show cumulative count of Article Views (full-text article views including HTML views, PDF and ePub downloads, according to the available data) and Abstracts Views on Vision4Press platform.
Data correspond to usage on the plateform after 2015. The current usage metrics is available 48-96 hours after online publication and is updated daily on week days.
Initial download of the metrics may take a while.


